 GOVERNMENT
OF INDIA
GOVERNMENT
OF INDIA
A Digital India Initiative
Please login using your email address as it is mandatory to access all the services of community.data.gov.in
GOVERNMENT
OF INDIA

Time Series Data - Area, Production and Yield Rate of Principal Crops in Tamil Nadu ...
Time Series Data Classification of Land in Tamil Nadu ...
Time Series Data Rainfall by Seasons in Tamil Nadu ...
Forecast Calendar for various Crops in Tamil Nadu ...
Wholesale Prices for Certain Agricultural Commodities by Districts in Tamil Nadu ...
Index Number and Average rate of daily wages paid to certain categories of Agricultural Labourers by Districts in Tamil Nadu ...
Normal Outturn of Principal Crops (Oil Seeds) by Districts in Tamil Nadu ...
Normal Outturn of Principal Crops (Cotton) by Districts in Tamil Nadu ...
Normal Outturn of Principal Crops (Tobacco) by Districts in Tamil Nadu ...
Normal Outturn of Principal Crops (Vegetables) by Districts in Tamil Nadu ...
Normal Outturn of Principal Crops (Fruits) by Districts in Tamil Nadu ...
Report detailing the COVID 19 Vaccination Coverage across Health Unit district wise in Tamil Nadu as on 08.04.2021 ...
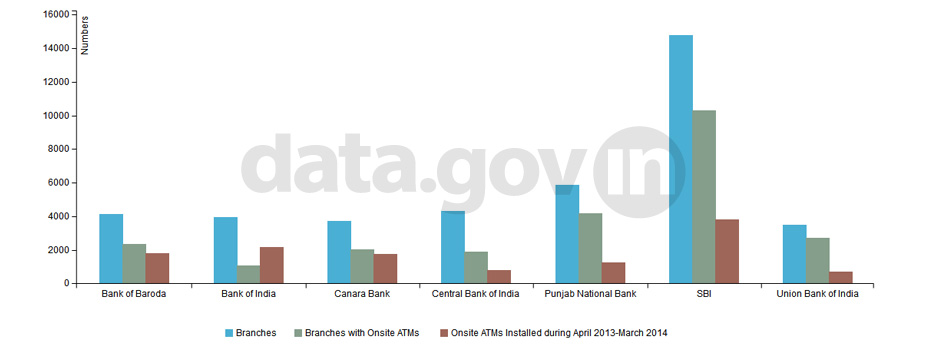
ATM Installation Status of Public Sector ... ATM Installation Status of Public Sector Banks upto March 2014 ...
According to no of branches, top 7 public sector banks are SBI, Punjab National Bank, Central Bank of India, Bank o ...
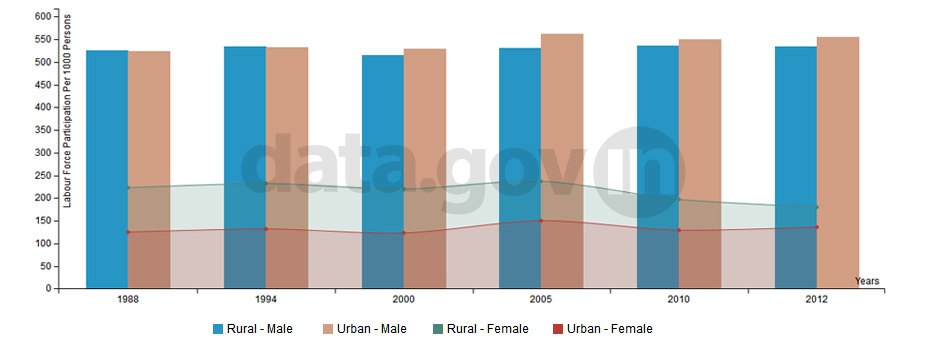
Labour Force Participation Rate Accordin ... Labour Force Participation Rate According to the Current Daily Status During 1988-2012 ...
Persons who are either working (or employed) or seeking or available for work (or unemployed) during the reference ...
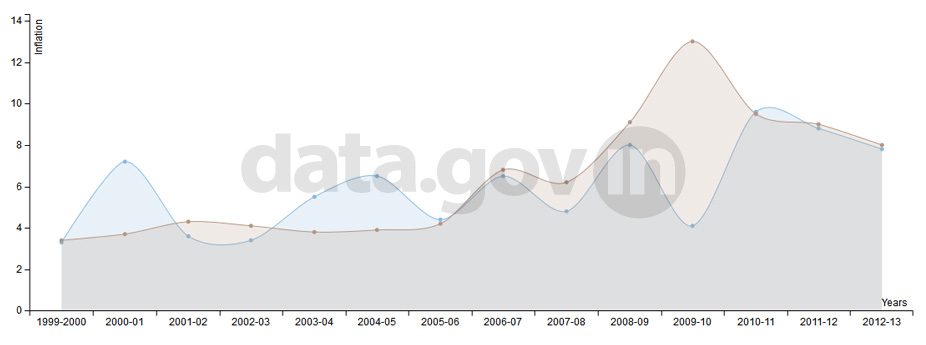
Annual Consumer Price Index and Wholesal ... Annual Consumer Price Index and Wholesale Price Index Inflation Rate during 1999-2013 ...
The annual rate of inflation, based on annual average Wholesale Price Index (WPI), stood at 7.8% in 2012-13, as com ...
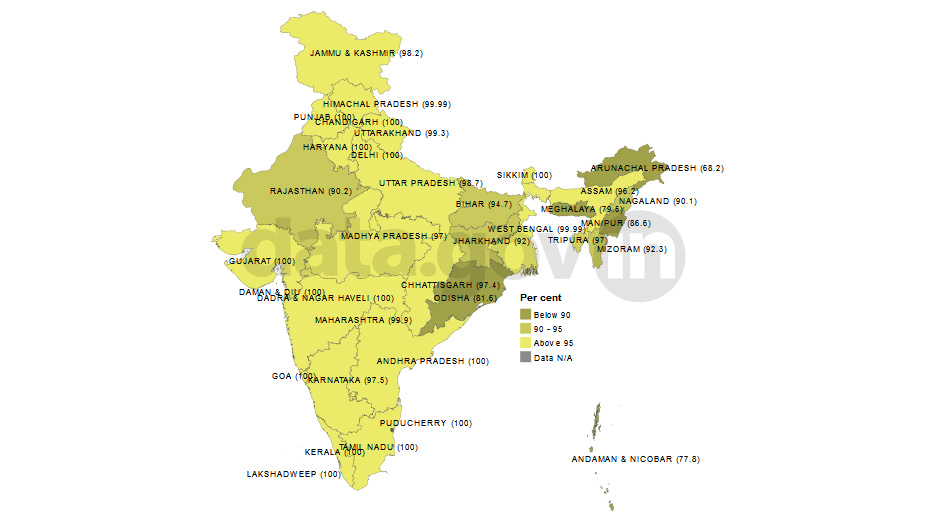
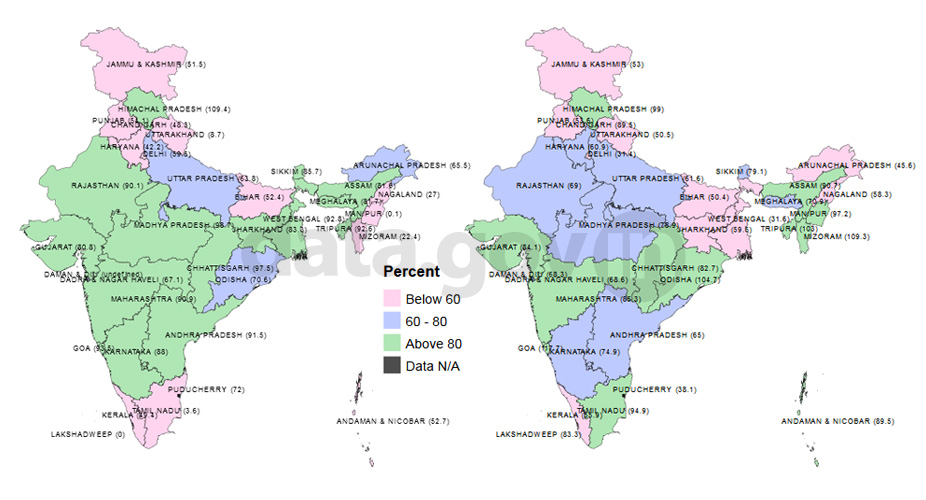
Village Electrification in India as on 3 ... Village Electrification in India as on 30th April, 2014 ...
As per the 2001 Census, there are Total 5,97,464 inhabited villages in India. Out of which, 5,71,168 villages have ...
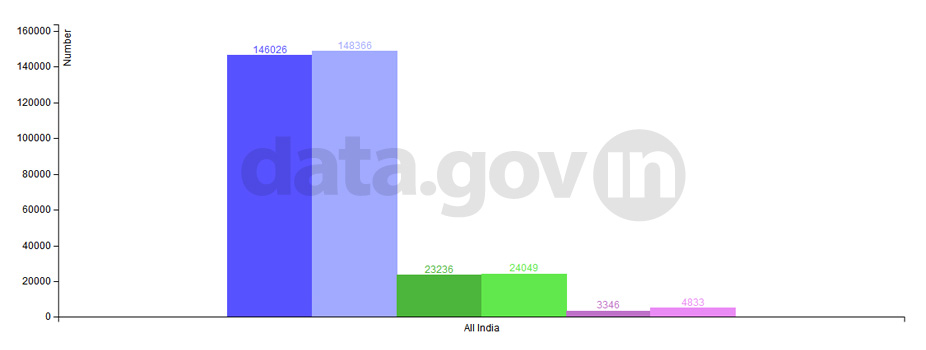
Sub-Centres, Primary Health Centres (PHC ... Sub-Centres, Primary Health Centres (PHCs) and Community Health Centres (CHCs) Functioning in India, 2005 and 2012 ...
During 2005-12, number of Sub-Centres increased by 1.6% from 146026 in 2005 to 148366 in 2012. Number of Primary H ...
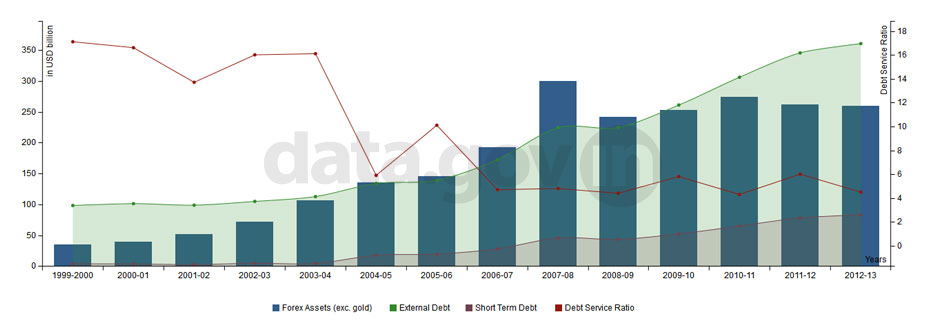
Debt and Forex Assets of India during 19 ... Debt and Forex Assets of India during 1999-2013 ...
The debt service ratio is the ratio of debt service payments made by or due from a country to that country’s expo ...
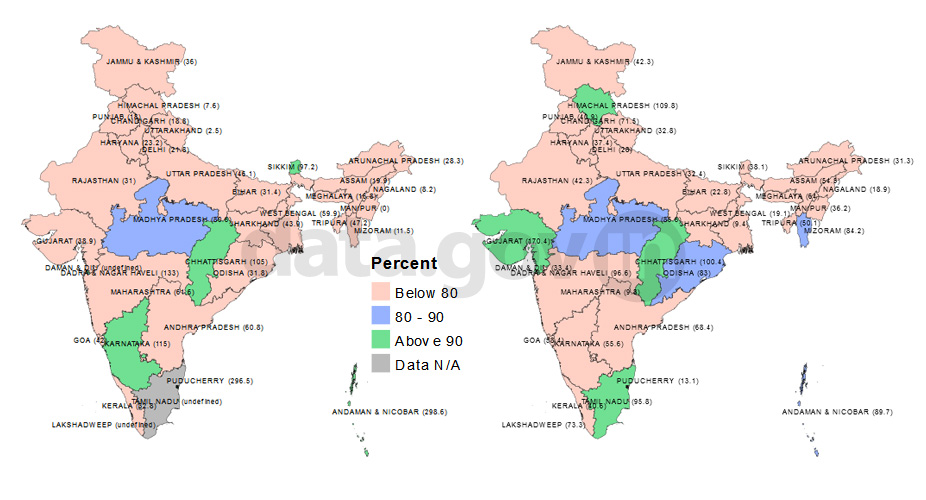
Achievements of need assessed for prophy ... Achievements of need assessed for prophylaxis against blindness due to Vitamin A Deficiency (5th Dose) during 2008- ...
India has witnessed a fluctuating trend in a achievements of need assessed for prophylaxis against blindness due to ...
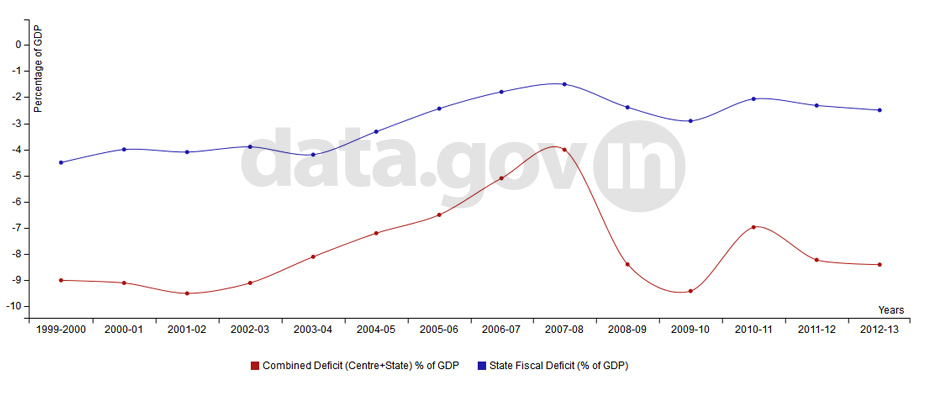
Fiscal Deficit of India during 1999-2013 Fiscal Deficit of India during 1999-2013
Fiscal deficit is the difference between the government expenditures and its revenues (excluding the money it borro ...
Achievements of need assessed for prophy ... Achievements of need assessed for prophylaxis against blindness due to Vitamin A Deficiency (1st Dose) during 2008- ...
India has witnessed a fluctuating trend in a achievements of need assessed for prophylaxis against blindness due to ...
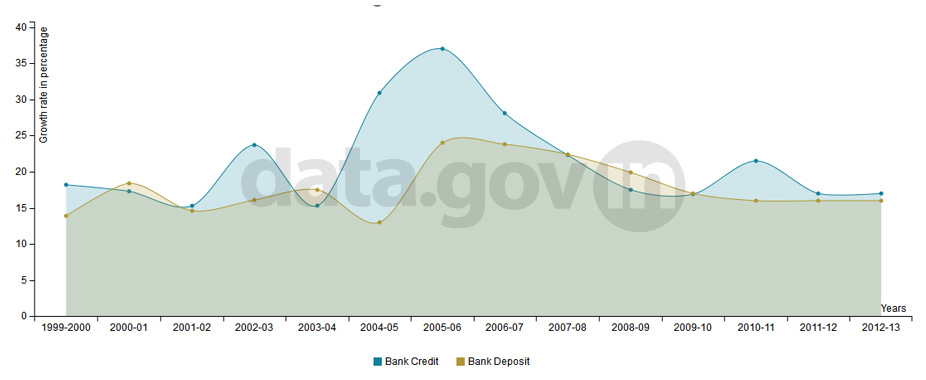
Bank Credit and Debit Growth During 1999-2013 Bank Credit and Debit Growth During 1999-2013
During 1999-2013, bank credit grew at an average annual growth rate of 21.29% and bank deposit grew at an average a ...
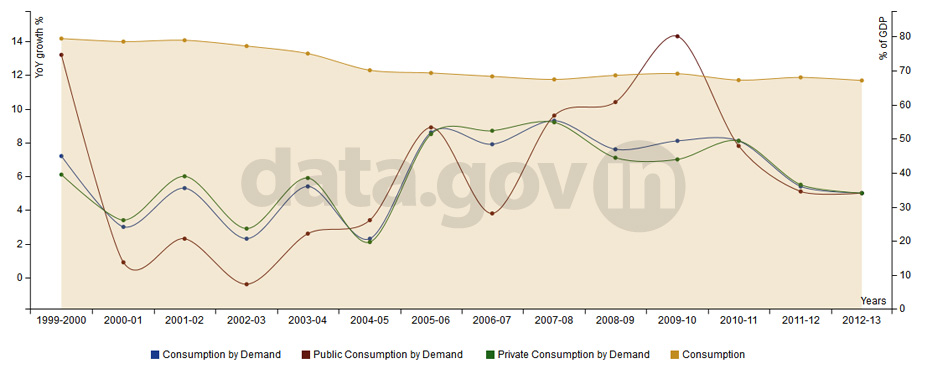
Consumption and Consumption by Demand Du ... Consumption and Consumption by Demand During 1999-2013 ...
During 1999-2013, consumption as a percentage of GDP declined by 15.5% from 79.4 in 1999 to 67.1 in 2012-13. Durin ...
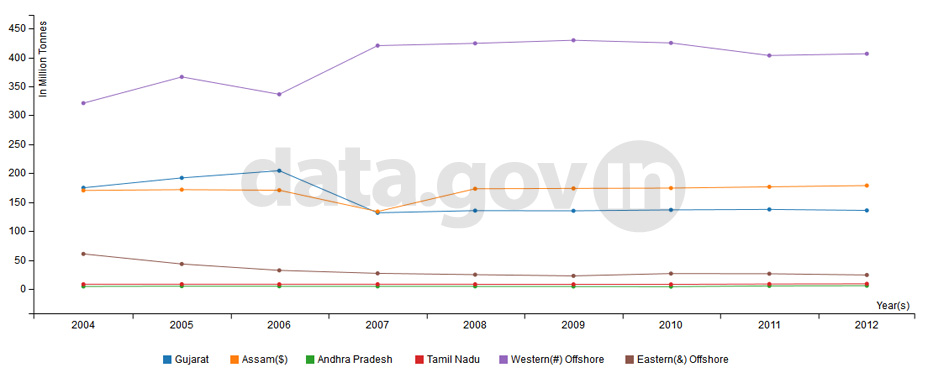
Reserves of Crude Oil in India during 2004-12 Reserves of Crude Oil in India during 2004-12
During 2004-12, reserves of Crude Oil grew by 2.8% from 739.08 million tonnes in 2004 to 759.59 million tonnes in 2 ...


