 GOVERNMENT
OF INDIA
GOVERNMENT
OF INDIA
A Digital India Initiative
Please login using your email address as it is mandatory to access all the services of community.data.gov.in
GOVERNMENT
OF INDIA

Details showing the Number of Mining and Quarrying Units with its Classification-wise Production in Coimbatore District in 2017-18 ...
Details of Statistics showing the Positive, Active, Discharged and Death COVID-19 Cases in Tamil Nadu as on 28.03.2021 ...
Details of Statistics showing the Positive, Active, Discharged and Death COVID-19 Cases in Tamil Nadu as on 27.03.2021 ...
Area under Non-Food Crops (Flowers) by Districts in Tamil Nadu ...
Details of Statistics showing the Positive, Active, Discharged and Death COVID-19 Cases in Tamil Nadu as on 26.03.2021 ...
Area under Non-Food Crops (Edible and Non-Edible Oil Seeds) by Districts in Tamil Nadu ...
Details showing the Head and Branch Libraries, libraries housed in Government / Private Building and number of Reading Rooms in Coimbator ...
Details showing the Legal Services available in Coimbatore District in 2017-18 ...
Details showing the Number of Persons registered and placed through placement in Coimbatore District in 2017-18 ...
Details showing the Area and Population in Municipal Bodies, Tax Collected by the Local Bodies and Rural Development Activities in Coimba ...
Details of Registered and Working Factories in Coimbatore District in 2017-18 ...
Details of Industrial Production, Small Scale Industries and Production and Value of Minerals in Coimbatore District in 2017-18 ...
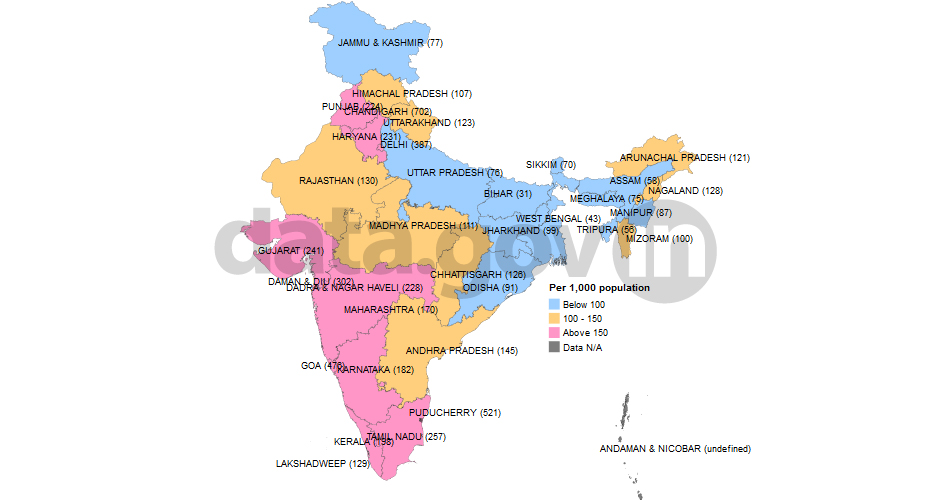
State/UT-wise Registered Motor Vehicles ... State/UT-wise Registered Motor Vehicles Per 1,000 Population in 2011-2012 ...
In 2011-12, Chandigarh with 702 has the highest registered motor vehicles per 1,000 population followed by Puducher ...
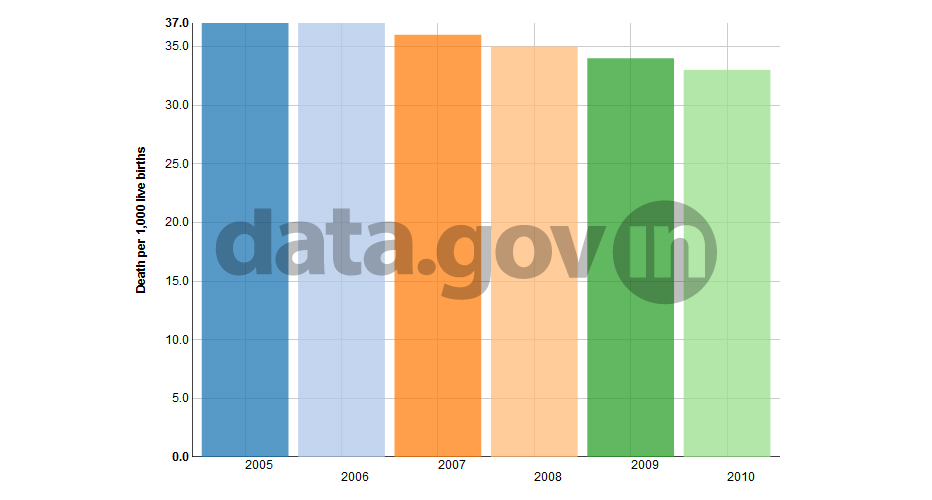
Neo-Natal Mortality Rate in India, 2005-2010 Neo-Natal Mortality Rate in India, 2005-2010
Decreasing trend has been seen in Neo-natal mortality rate in India. The Neo-natal mortality rate reduced from 37 i ...
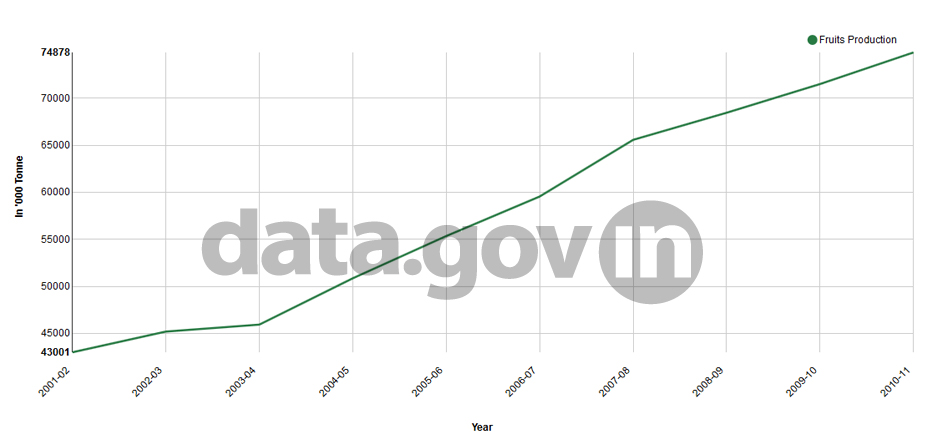
Trend of fruits production in India, 200 ... Trend of fruits production in India, 2001-02 to 2010-11 ...
Increasing trend has been seen in production of fruits in India. The production of fruits has increased from 43001. ...
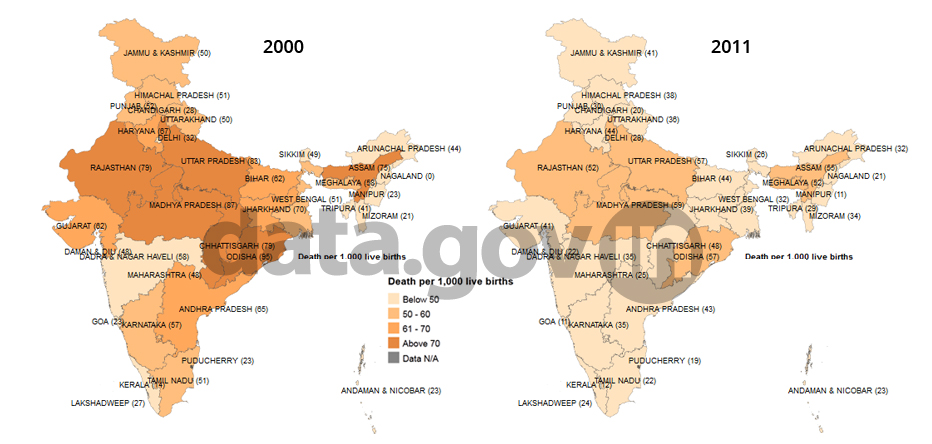
State/UT-wise Infant Mortality Rate, 200 ... State/UT-wise Infant Mortality Rate, 2000 and 2011 ...
Decreasing trend seen in India in Infant Mortality Rate (68 in 2000 and 44 in 2011). Madhya Pradesh, Odisha and Utt ...
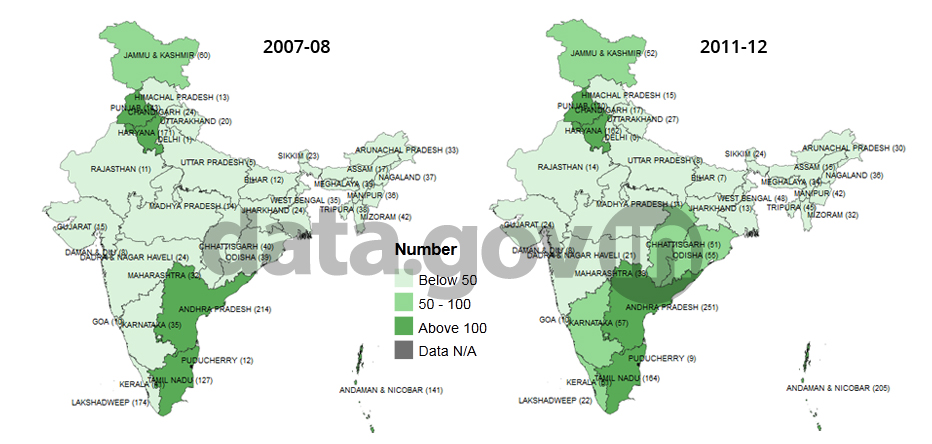
State/UT-wise Per Capita Availability of ... State/UT-wise Per Capita Availability of Eggs, 2007-08 and 2011-12 ...
Increasing trend seen in India in Per Capita Availability of Eggs (47 in 2007-08 and 55 in 2011-12). Andhra Pradesh ...
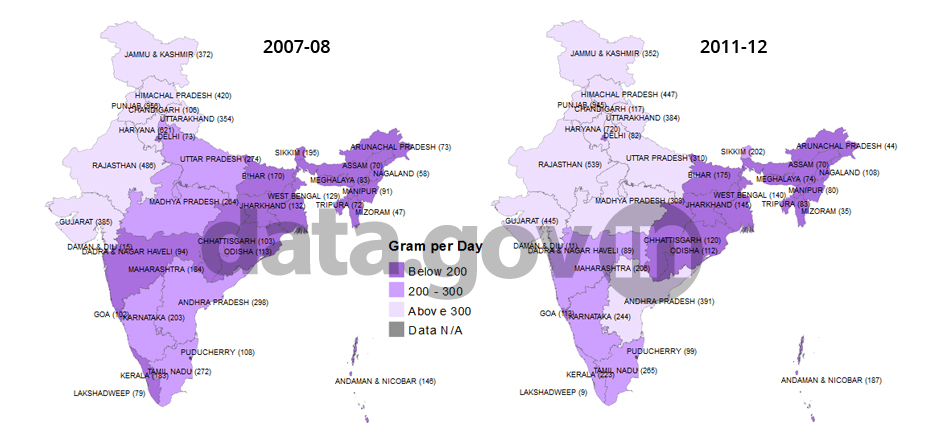
State/UT-wise Estimates Per Capita Avail ... State/UT-wise Estimates Per Capita Availability of Milk During 2007-08 and 2011-12 ...
Increasing trend seen in India in Per Capita Availability Of Milk (260 in 2007-08 and 290 in 2011-12). Punjab, Hary ...
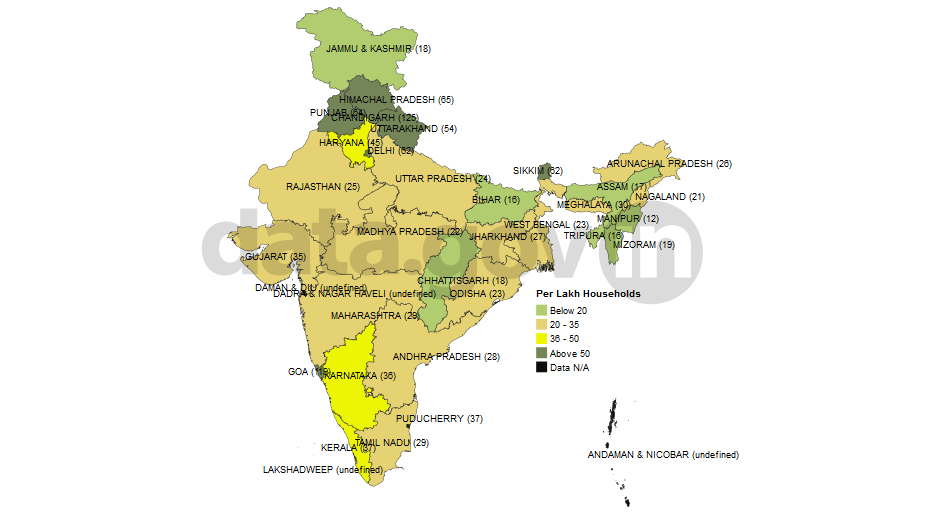
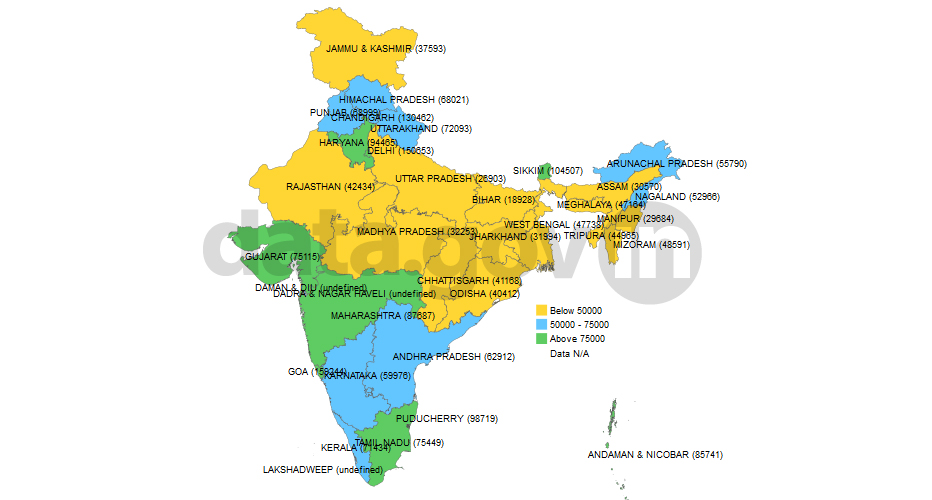
Number of Nationalized Bank Branches Per ... Number of Nationalized Bank Branches Per Lakh Households – 2012 ...
At the end of March, 2012 there were 70455 nationalized bank branches across India, with each such nationalized bra ...
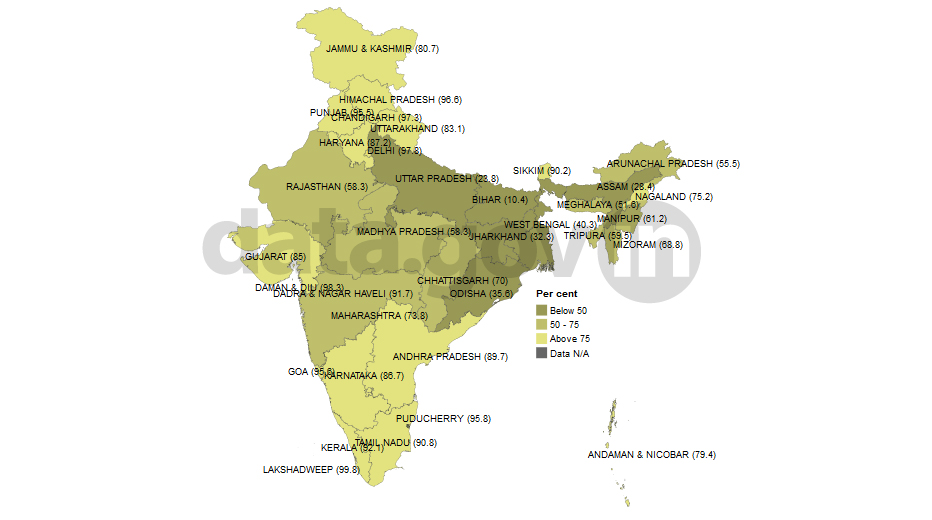
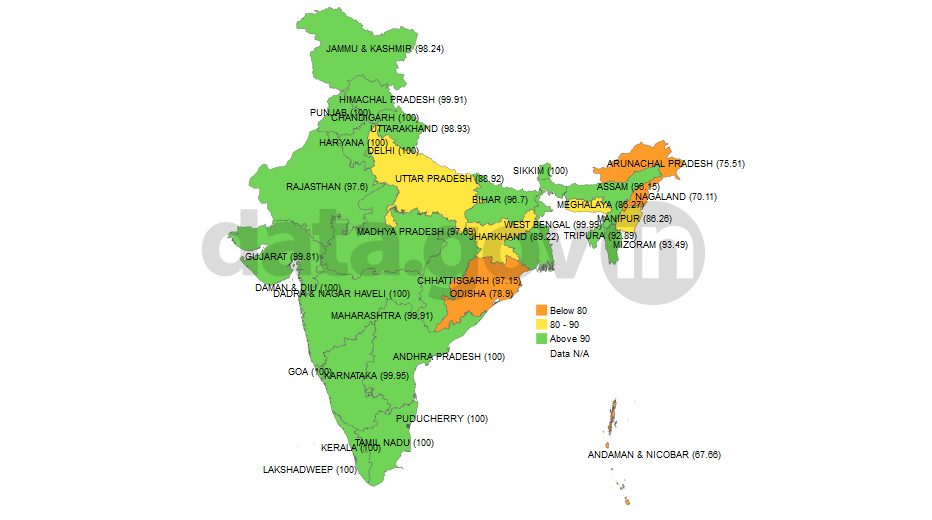
State/UT-wise Percentage Distribution of ... State/UT-wise Percentage Distribution of Rural Households Having Electricity, 2011 ...
In 2011, Lakshadweep with 99.8% has the highest percentage of rural households having electricity followed by Daman ...
India's per capita income in the year 2010-11 grew by 15.6 percent - the highest since 2006-07. For 17 States/UTs p ...
Village Electrification in India as on 3 ... Village Electrification in India as on 31st October, 2013 ...
As per the 2001 Census there are a total of 5,93,732 villages in India out of which 5,61,613 villages have been ele ...
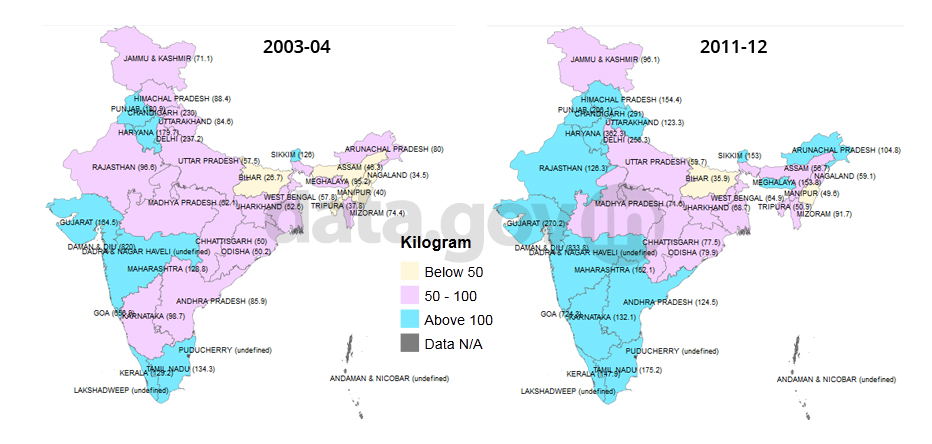
States/UTs-wise Per Capita Sales of Petr ... States/UTs-wise Per Capita Sales of Petroleum Products, 2003-04 and 2011-12 ...
Increasing trend in “Per Capita Sales of Petroleum Products” (112.9 in 2003-04 and 116.3 in 2011-12) seen in In ...
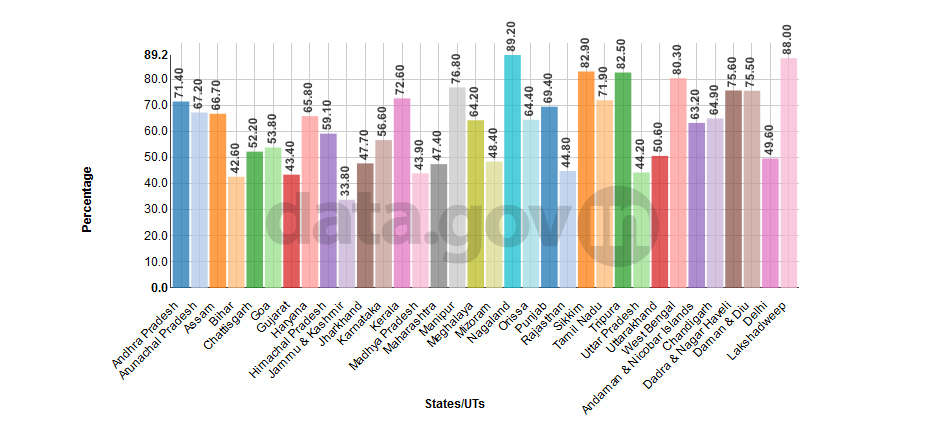
Women Participation in 15th Lok Sabha El ... Women Participation in 15th Lok Sabha Elections ...
India - the largest democracy in the world went for its 15th Lok Sabha elections in the the year 2009. For the 1 ...


