Important Note

Please login using your email address as it is mandatory to access all the services of community.data.gov.in

GOVERNMENT OF INDIAGOVERNMENT OF INDIA
A Digital India Initiative

Monthly Archives: December 2013

Grid List
  • Year-wise and Sector-wise Contribution of GDP

    Change in composition of GDP for major sectors of the economy such as Agriculture & Allied Services, Industry, Mining & Quarryin ...
    Community: data.gov.in
    December 18, 2013
    | 22571 views
  • Women Participation in 15th Lok Sabha Elections

    India - the largest democracy in the world went for its 15th Lok Sabha elections in the the year 2009. For the 15th Lok Sabha election ...
    Community: data.gov.in
    December 27, 2013
    | 1555 views
  • Village Electrification in India as on 31st October, 2013

    As per the 2001 Census there are a total of 5,93,732 villages in India out of which 5,61,613 villages have been electrified as on 31st Oc ...
    Community: data.gov.in
    December 31, 2013
    | 8113 views
  • Subsidies as Percentage of Total Expenditure

    Subsidies as percentage of total expenditure stood at 9.22 percent in the year 2004-05, while it has almost doubled to 18 percent in the ...
    Community: data.gov.in
    December 20, 2013
    | 1033 views
  • Status on Rajiv Gandhi Grameen Vidyutikaran Yojana (RGGVY)

    During 2007 to 2012, total 65,971 villages have been electrified and free electricity connections to 187.53 lakh Below Poverty Line (BPL) ...
    Community: data.gov.in
    December 13, 2013
    | 3002 views
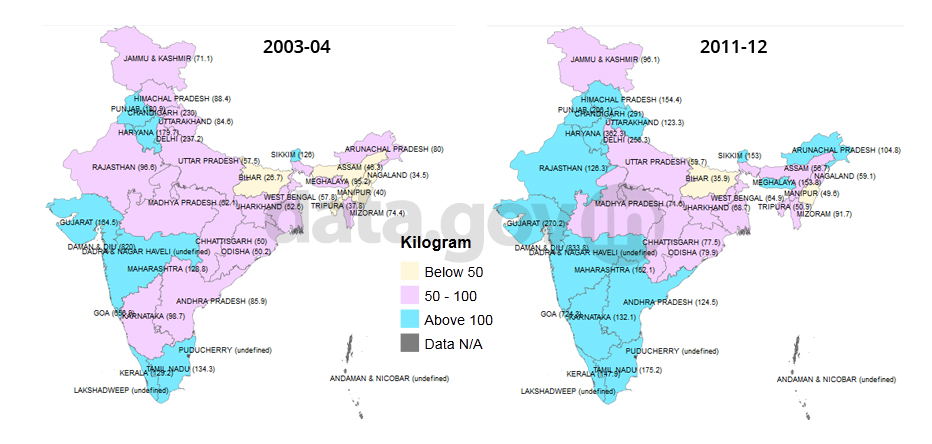
  • States/UTs-wise Per Capita Sales of Petroleum Products, 2003-04 and 2011-12

    Increasing trend in “Per Capita Sales of Petroleum Products” (112.9 in 2003-04 and 116.3 in 2011-12) seen in India. Goa, Puducherry ...
    Community: data.gov.in
    December 30, 2013
    | 463 views
  • States/UTs-wise Crude Death Rate, 2001 and 2011

    Decreasing trend in the Crude Death Rate(8.4 in 2001 and 7.1 in 2011) seen in India. Odisha, Madhya Pradesh, Assam, Uttar Pradesh and Chh ...
    Community: data.gov.in
    December 23, 2013
    | 1929 views
  • States/UTs-wise Crude Birth Rate, 2001 and 2011

    The Crude Birth Rate of India decreased from 25.4 in 2001 to 21.8 in 2011 showing decrease of 3.6. BIMARU states have the higher Crude Bi ...
    Community: data.gov.in
    December 19, 2013
    | 3086 views
  • State-wise Vehicles Registered – 2011

    India has experienced a tremendous increase in the total number of registered motor vehicles in the last decade, from about 5.4 crores in ...
    Community: data.gov.in
    December 24, 2013
    | 963 views
  • State-wise Share of Female Workers

    The chart shows the percentage of Working Females in the Total Working Population for the various states of India. It may be observed ...
    Community: data.gov.in
    December 6, 2013
    | 3722 views
  • India’s Share in World Exports: Commodity-wise

    In 2011, among the top export items of the world at the SITC 3-Digit level classification, India has only 14 items with a share of 4 per ...
    Community: data.gov.in
    December 17, 2013
    | 998 views
  • Index of Eight Core Industries

    The combined Index of Eight Core Industries stands at 151.2 in June, 2013, which was 0.1 % lower compared to the index of June, 2012. Co ...
    Community: data.gov.in
    December 26, 2013
    | 596 views
top