 GOVERNMENT
OF INDIA
GOVERNMENT
OF INDIA
A Digital India Initiative
Please login using your email address as it is mandatory to access all the services of community.data.gov.in
GOVERNMENT
OF INDIA

Social Welfare Detail in Chennai District 2017-18 ...
Details of Recreation and Cultural Services like Cinema Theaters, Clubs and Associations in Chennai District in 2017-18 ...
Irrigated and Un-Irrigated Area under Food Crops Total Food grains by Districts in Tamil Nadu ...
Irrigated and Un-Irrigated Area under various Food Crops (Sugar Crops) by Districts in Tamil Nadu ...
Details of Restaurants and Hotels, with and Lodging Facilities in Chennai District in 2017-18 ...
Details of Authorized Automobile, Electrical and Electronic Goods Repair and Service Units in Chennai District in 2017-18 ...
Registration Details in Chennai District 2017-18 ...
Details of Statistics showing the Positive, Active, Discharged and Death COVID-19 Cases in Tamil Nadu as on 21.03.2021 ...
Details of Statistics showing the Positive, Active, Discharged and Death COVID-19 Cases in Tamil Nadu as on 20.03.2021 ...
Details of Statistics showing the Positive, Active, Discharged and Death COVID-19 Cases in Tamil Nadu as on 19.03.2021 ...
Details of Cooperative Societies in Chennai District in 2017-18 ...
Details showing the Number of Commercial Banks and Insurance Schemes in Chennai District in 2017-18 ...
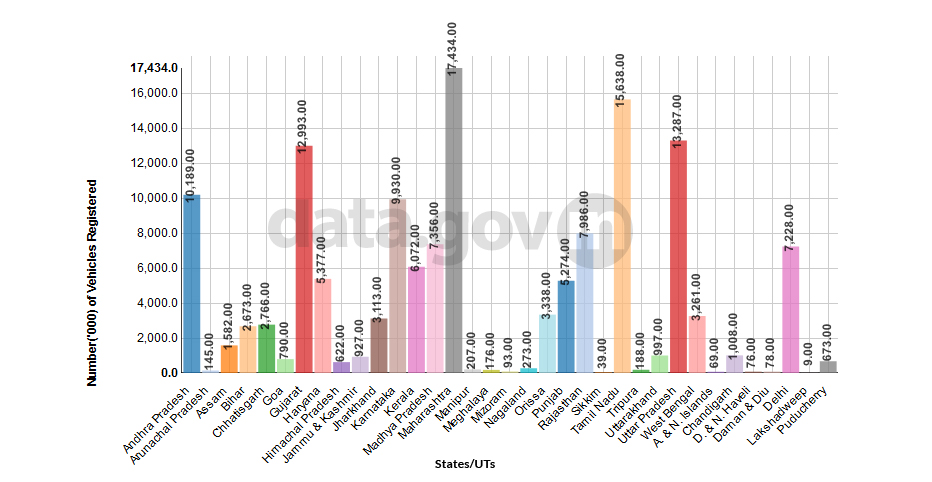
State-wise Vehicles Registered – 2011 State-wise Vehicles Registered – 2011
India has experienced a tremendous increase in the total number of registered motor vehicles in the last decade, fr ...
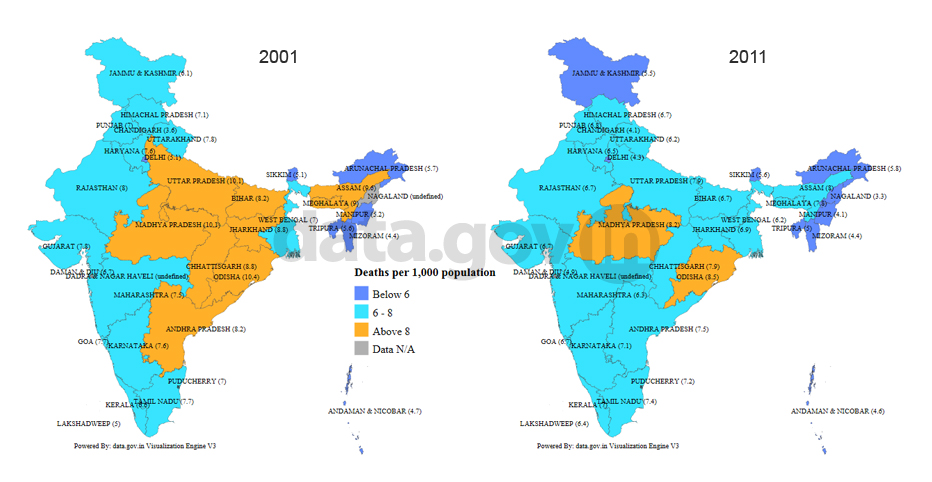
States/UTs-wise Crude Death Rate, 2001 a ... States/UTs-wise Crude Death Rate, 2001 and 2011 ...
Decreasing trend in the Crude Death Rate(8.4 in 2001 and 7.1 in 2011) seen in India. Odisha, Madhya Pradesh, Assam, ...
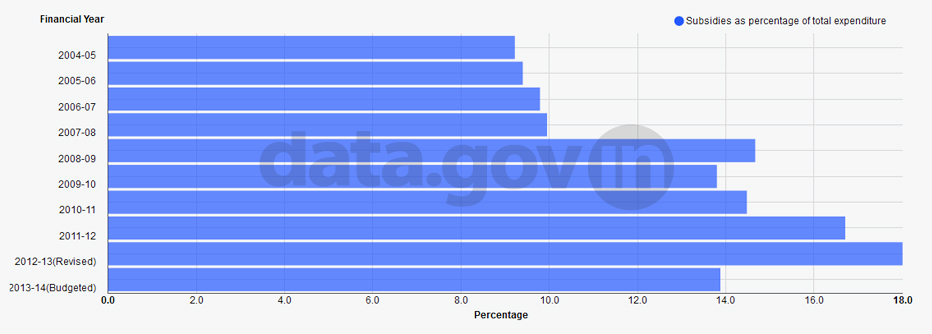
Subsidies as Percentage of Total Expenditure Subsidies as Percentage of Total Expenditure
Subsidies as percentage of total expenditure stood at 9.22 percent in the year 2004-05, while it has almost doubled ...
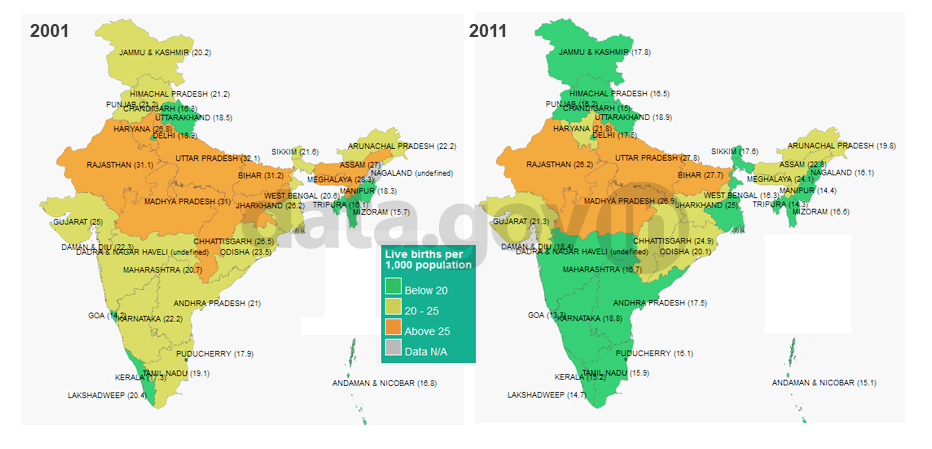
States/UTs-wise Crude Birth Rate, 2001 a ... States/UTs-wise Crude Birth Rate, 2001 and 2011 ...
The Crude Birth Rate of India decreased from 25.4 in 2001 to 21.8 in 2011 showing decrease of 3.6. BIMARU states ha ...
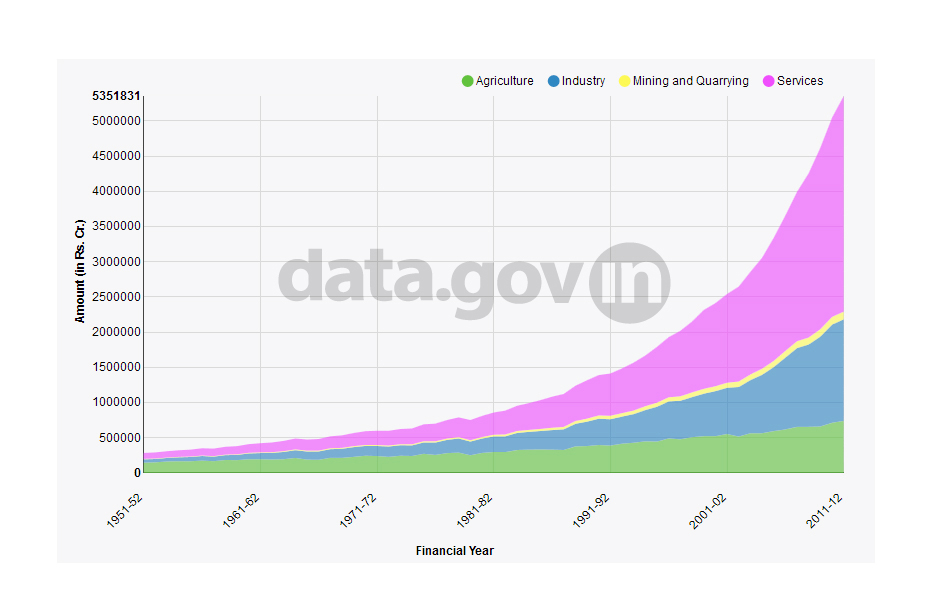
Year-wise and Sector-wise Contribution of GDP Year-wise and Sector-wise Contribution of GDP
Change in composition of GDP for major sectors of the economy such as Agriculture & Allied Services, Industry,� ...
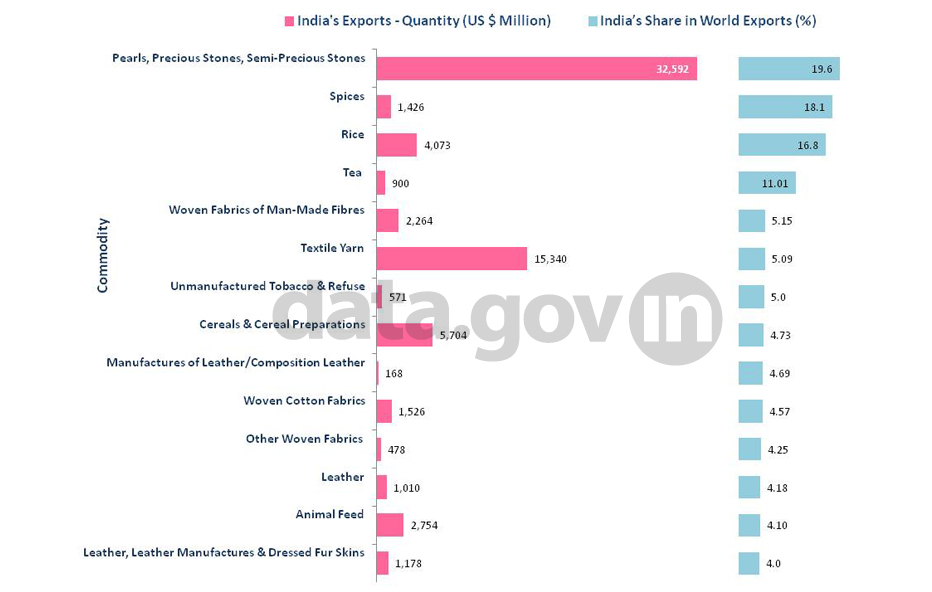
India’s Share in World Exports: Co ... India’s Share in World Exports: Commodity-wise ...
In 2011, among the top export items of the world at the SITC 3-Digit level classification, India has only 14 items ...
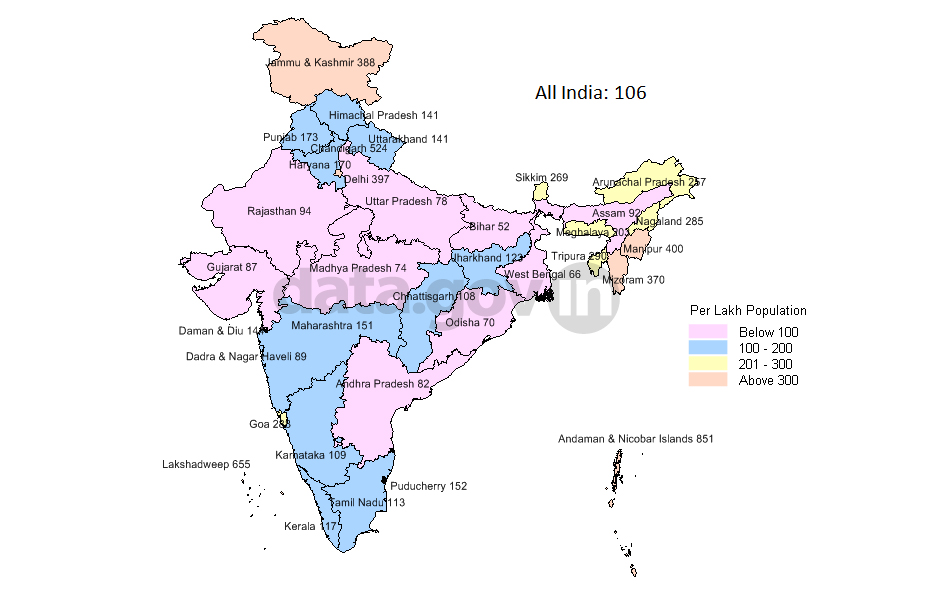
Civil Police per Lakh Population during 2011 Civil Police per Lakh Population during 2011
Andaman & Nicobar Islands with 851 has the highest Civil Police per Lakh Population followed by Lakshadweep wit ...
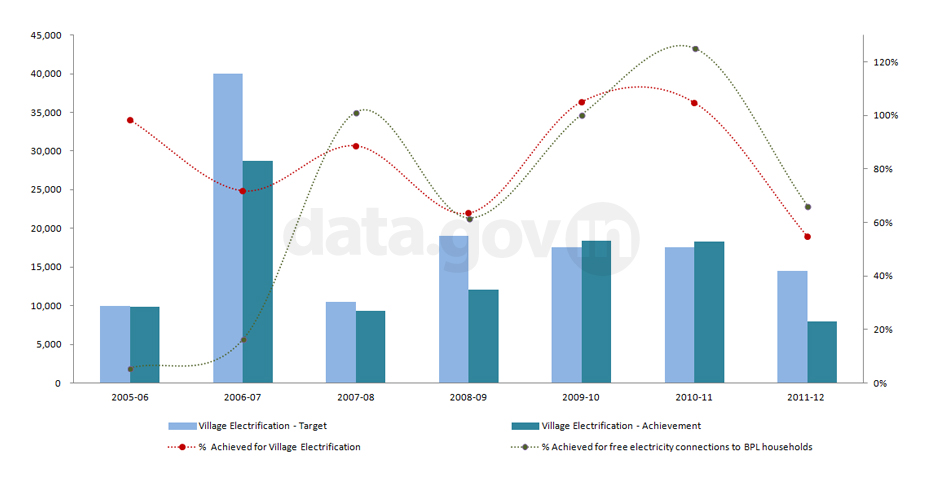
Status on Rajiv Gandhi Grameen Vidyutika ... Status on Rajiv Gandhi Grameen Vidyutikaran Yojana (RGGVY) ...
During 2007 to 2012, total 65,971 villages have been electrified and free electricity connections to 187.53 lakh Be ...
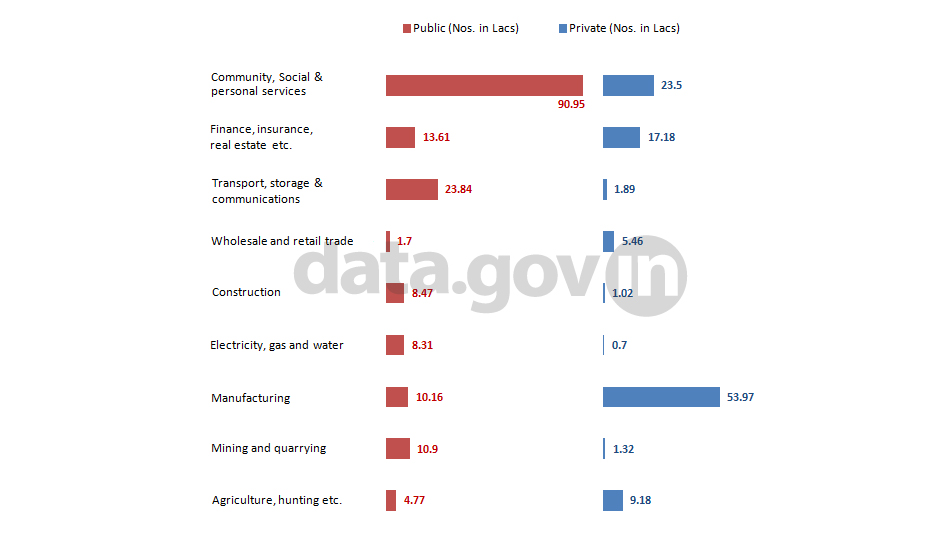
Employment in Organised Sectors – ... Employment in Organised Sectors – Public and Private ...
At the end of financial year 2010-11, a total of 2.9 cr workforce were employed in the organized sector which incl ...
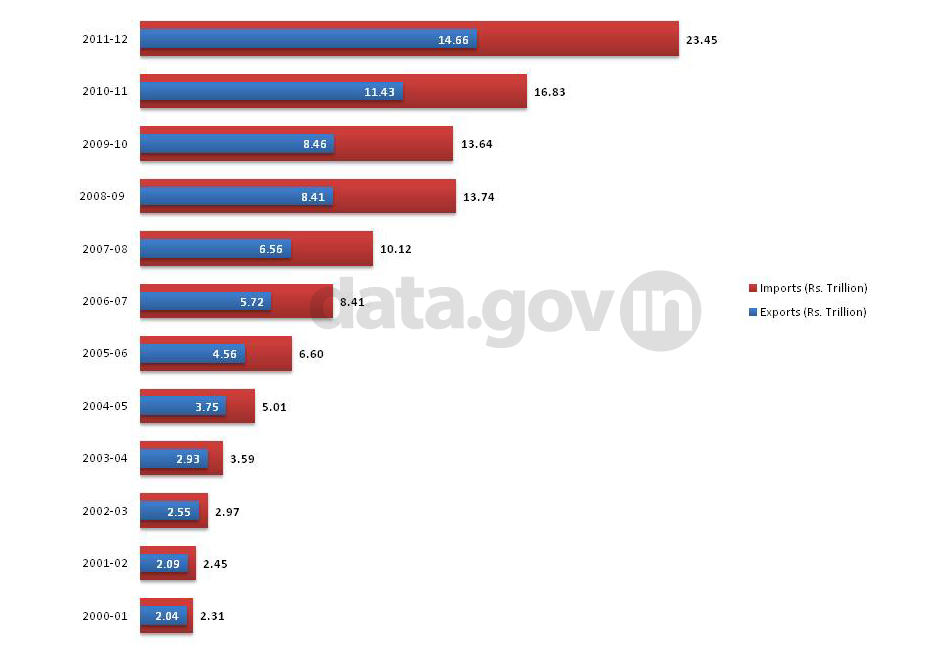
India's share in global exports and imports increased from 0.7 per cent and 0.8 per cent respectively in 2000 to 1. ...
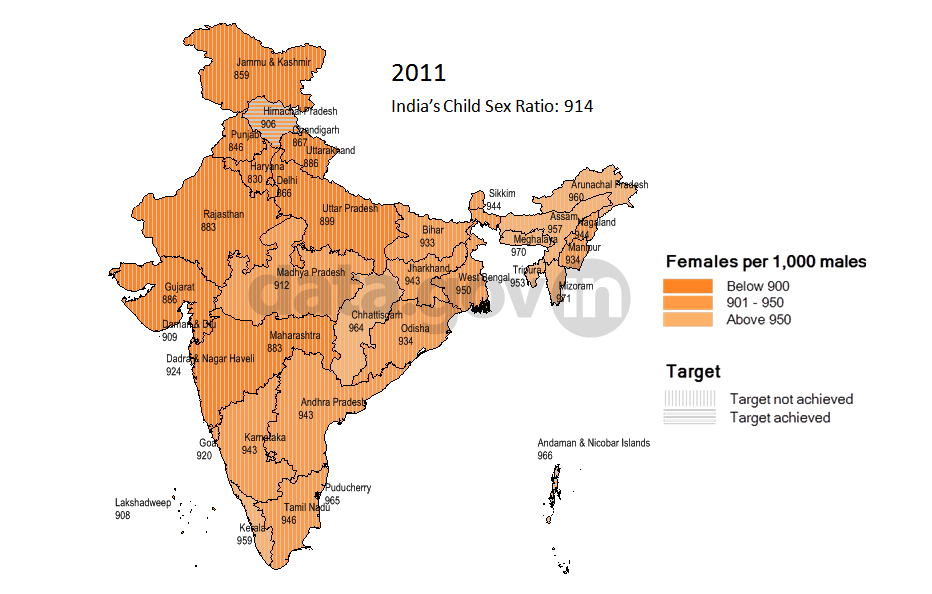
Child Sex Ratio (0-6 Years) for States/U ... Child Sex Ratio (0-6 Years) for States/UTs based on Census 2011 and goal for Eleventh Plan Period 2011-12 ...
Decreasing trend in the Child Sex Ratio (0-6) seen in India (927 in 2001 and 914 in 2011). Mizoram with 971 has the ...
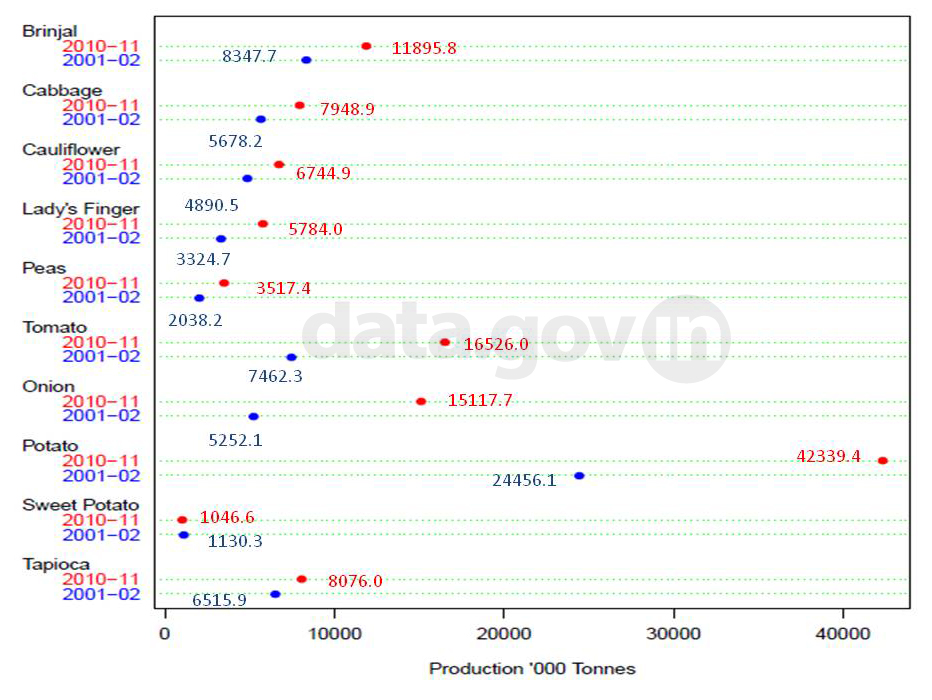
All India Major Vegetables Production All India Major Vegetables Production
In the year 2010-11, vegetables were grown in the total area of 8495.1 thousand hectares with a total production o ...


