 GOVERNMENT
OF INDIA
GOVERNMENT
OF INDIA
A Digital India Initiative
Please login using your email address as it is mandatory to access all the services of community.data.gov.in
GOVERNMENT
OF INDIA

Percentage of Area under Important Crops to Gross Sown Area by Districts in Tamil Nadu ...
Area under Non-Food Crops (Green Manure Crops) by Districts in Tamil Nadu ...
Area under Non-Food Crops (Fodder Crops) by Districts in Tamil Nadu ...
Details of Recreation and Cultural Services like Cinema Theatres, Clubs and Associations in Coimbatore District in 2017-18 ...
Details of Restaurants and Hotels, with and Lodging Facilities in Coimbatore District in 2017-18 ...
Details of Authorized Automobile, Electrical and Electronic Goods Repair and Service Units in Coimbatore District in 2017-18 ...
Registration Details in Coimbatore District 2017-18 ...
Printing and Publication Details in Coimbatore District 2017-18 ...
Public Health Details in Coimbatore District 2017-18 ...
Police and Prisons Details in Coimbatore District 2017-18 ...
Non Conventional Energy Generation Detail in Coimbatore District 2017-18 ...
Details of Statistics showing the Positive, Active, Discharged and Death COVID-19 Cases in Tamil Nadu as on 29.03.2021 ...
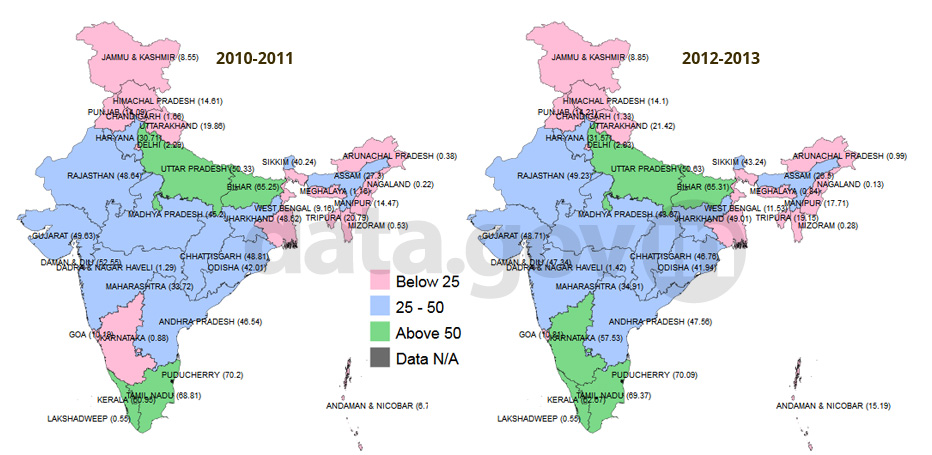
Percentage of OBC Enrolment at Upper Pri ... Percentage of OBC Enrolment at Upper Primary Level ...
Increasing trend has been seen in India in Percentage of OBC Enrolment at Upper Primary Level 40.27% in 2011-12 and ...
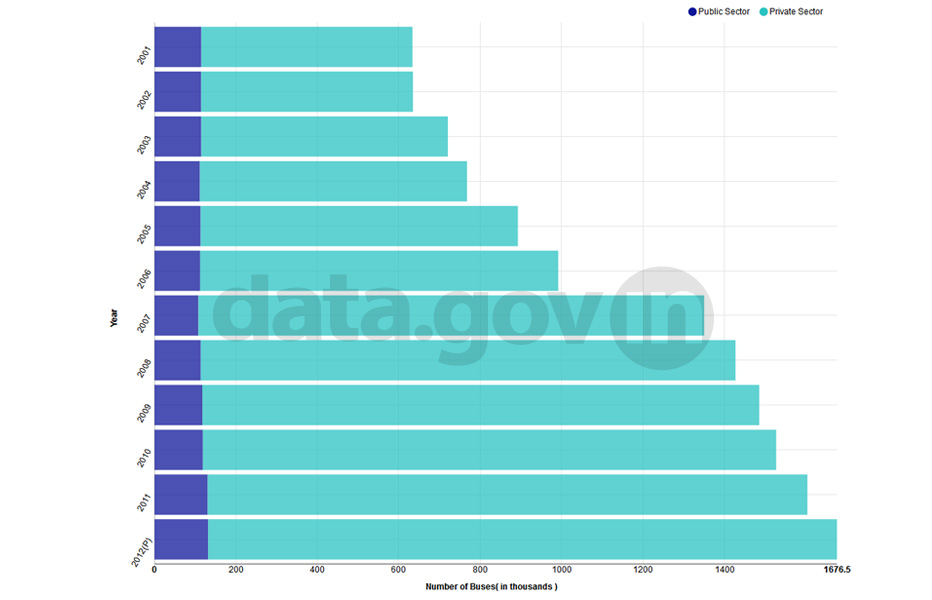
Buses Owned by the Public and Private Se ... Buses Owned by the Public and Private Sectors during 2001-2012 ...
During 2001-2012, number of buses owned by public sector has marginally increased at a CAGR of 1.2% and number of b ...
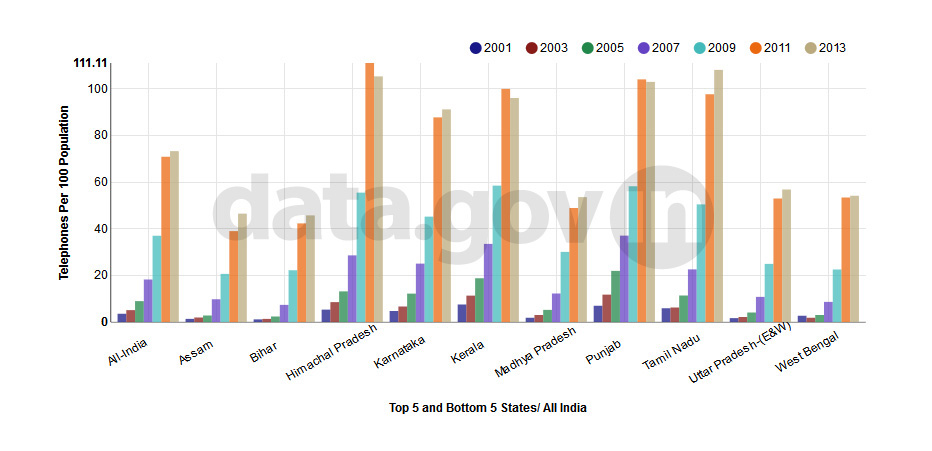
Telephones per 100 Population during 2001-13 Telephones per 100 Population during 2001-13
During 2001-2013, telephones per 100 population in India has increased at a CAGR of 29%. During this period highest ...
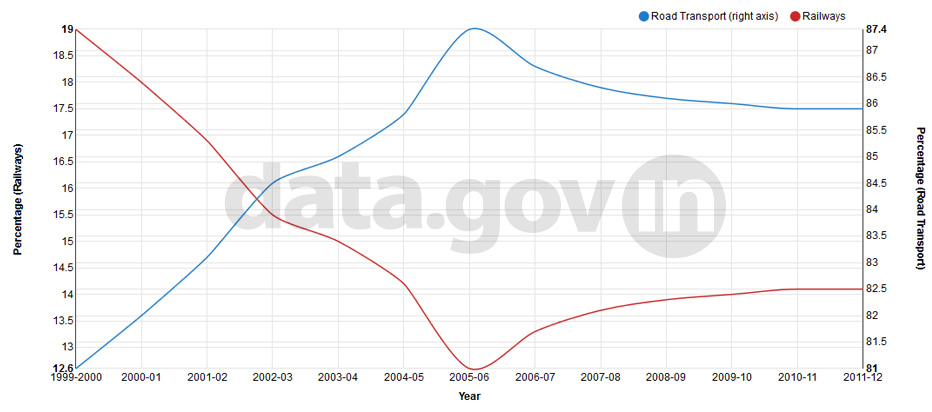
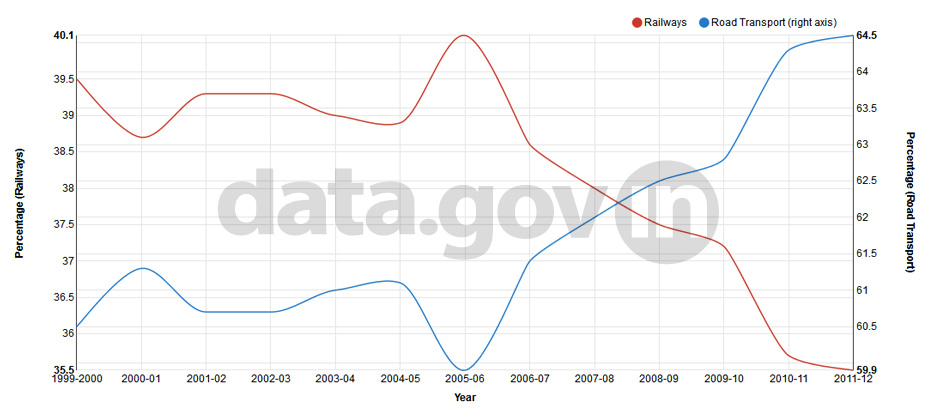
Passenger Movement of Road Transport and ... Passenger Movement of Road Transport and Railways ...
During 1999-2012, Passenger movement via Road Transport has increased by CAGR of 10.9% and Passenger movement via R ...
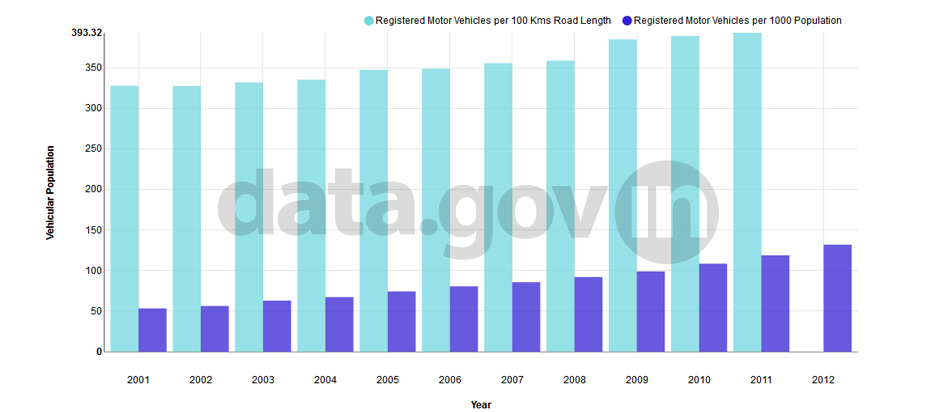
Vehicular Population during 2001-2012 Vehicular Population during 2001-2012
During 2001 to 2012 registered motor vehicles per 1000 population has increased by CAGR of 10.2%. During this perio ...
Number of Accidents due to Overloading/O ... Number of Accidents due to Overloading/Overcrowding during 2006-12 ...
During 2006-12, Number of Accidents in India due to overloading/overcrowding has decreased by 16%. Among all the st ...
Percentage of OBC Enrolment at Primary Level Percentage of OBC Enrolment at Primary Level
Increasing trend has been seen in India in Percentage of OBC Enrolment at Primary Level 40.09 % in 2010-11 and 42.9 ...
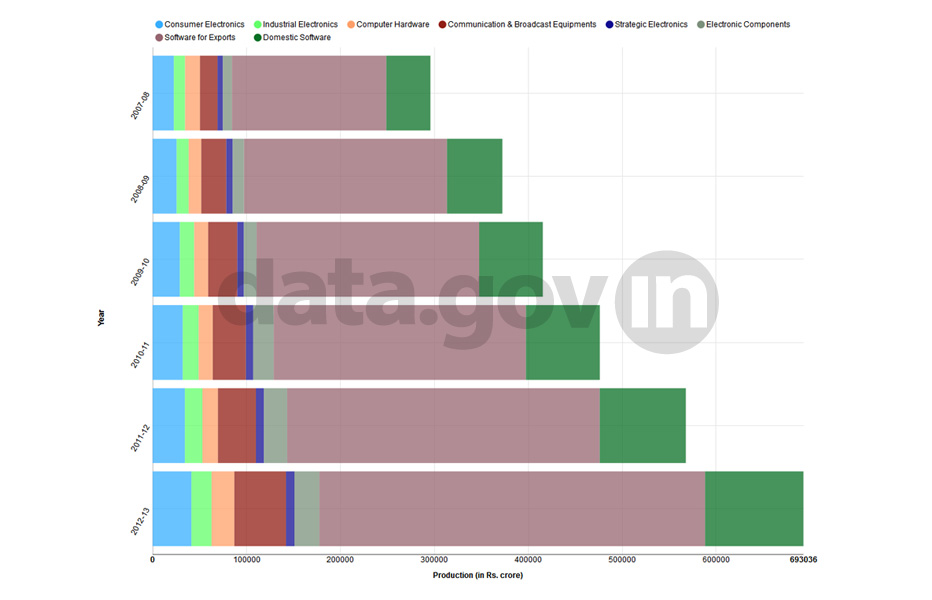
Electronics and IT Production of India d ... Electronics and IT Production of India during 2007-13 ...
During 2007-13, production of Hardware grew at a CAGR of 16% and production of software grew at a CAGR of 20%. Duri ...
Freight Movement of Road Transport and R ... Freight Movement of Road Transport and Railways ...
During 1999-2012, Freight movement via Road Transport has increased by CAGR of 8.3% and Freight movement via Railwa ...
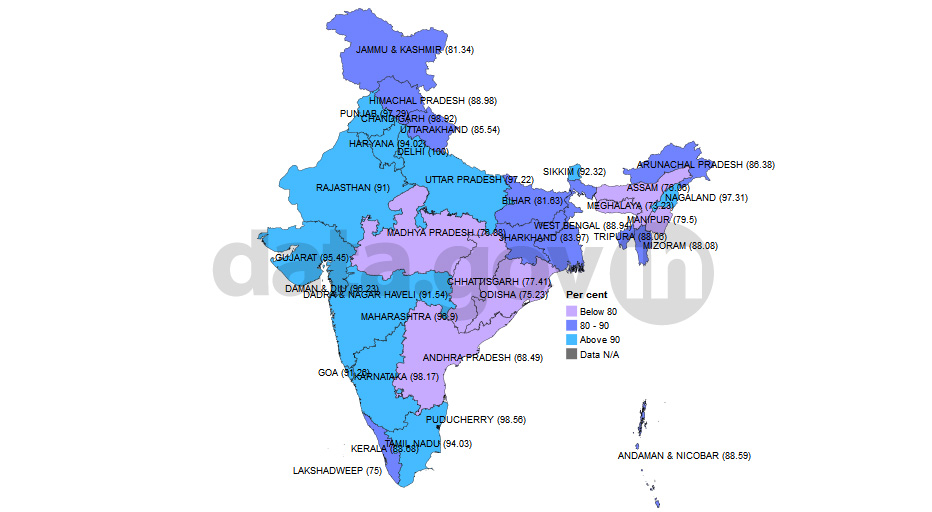
Percentage of Schools having Functional ... Percentage of Schools having Functional Boys Toilet ...
Delhi has highest Percentage of Schools having Functional Boys Toilet 100.0% in 2012-13 in comparison to other stat ...
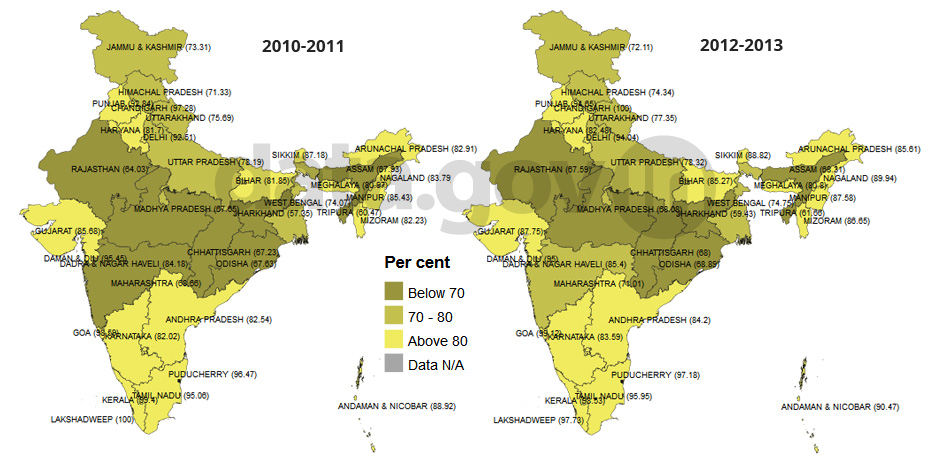
Percentage of Schools with Female Teachers Percentage of Schools with Female Teachers
Increasing trend has been seen in India in Schools with Female Teachers 75.08% in 2010-11 and 76.48% in 2012-13. Ch ...
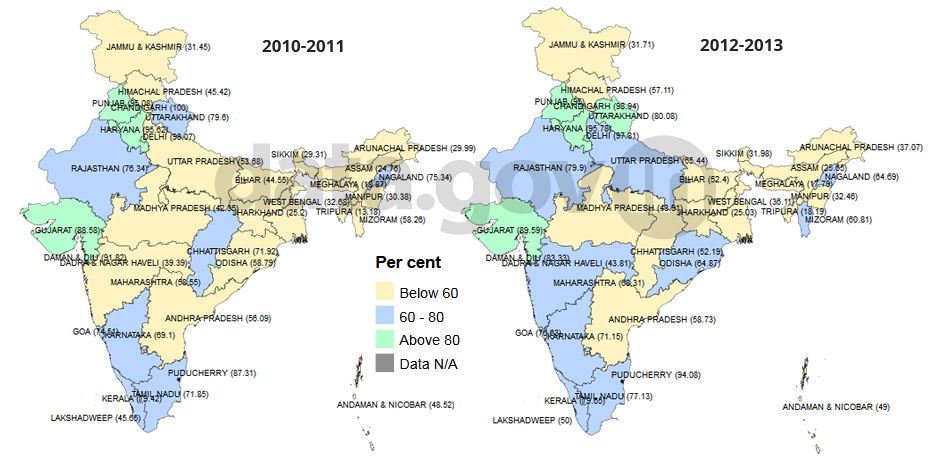
Percentage of Schools having boundary wall Percentage of Schools having boundary wall
Increasing trend has been seen in India in Schools having boundary wall (55.41% in 2010-11 and 59.48% in 2012-13). ...


