 GOVERNMENT
OF INDIA
Please login using your email address as it is mandatory to access all the services of community.data.gov.in
 GOVERNMENT
OF INDIA
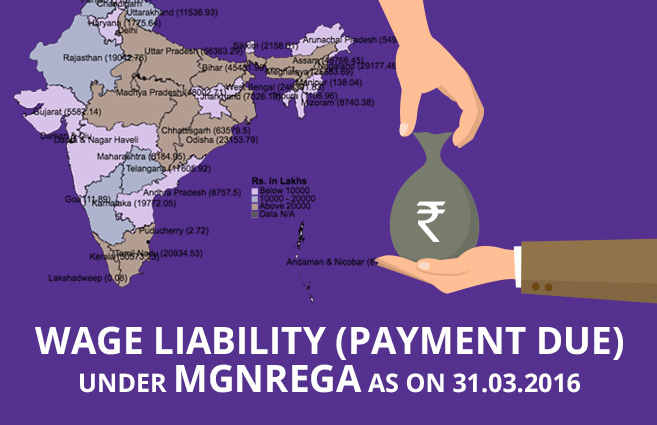
Wage Liability (Payment Due) under MGNREGA as on 31.03.2016 Wage Liability (Payment Due) under MGNREGA as on 31.03.2016
The Wage Liability (Payment Due) under MGNREGA in India as a whole was Rs. 826117.43 lakhs as on 31.03.2016. Th ...
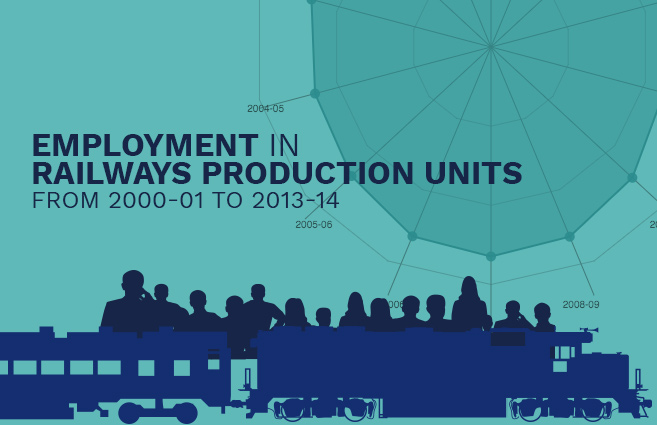
Employment in Railways Production Units from 2000-01 to 2013-14 Employment in Railways Production Units from 2000-01 to 2013-14
The number of total employees in Railway production units was 51241 in 2000-01. The number of total employees i ...
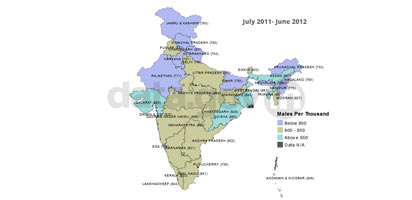
Labour Force Participation Rate of Male (15-59 years age) as per CWS approa ... Labour Force Participation Rate of Male (15-59 years age) as per CWS approa ...
Labour-force participation rate (LFPR) is defined as the proportion of persons/person-days in the labour-force to t ...
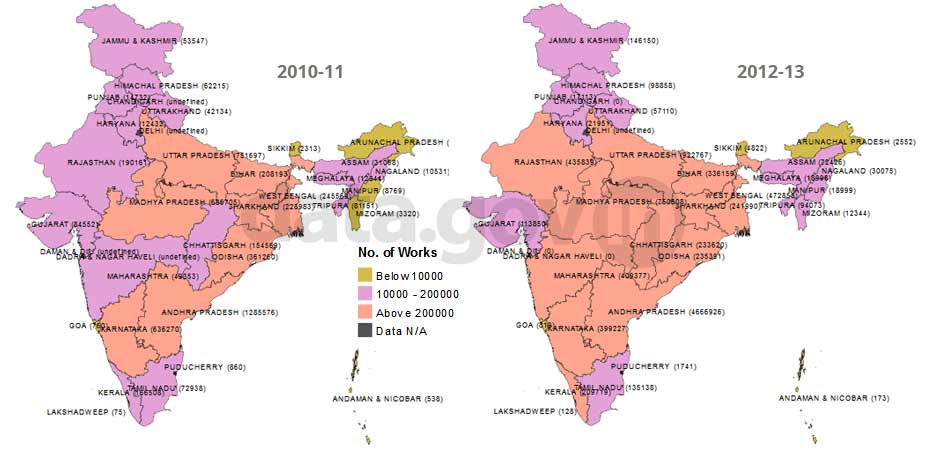
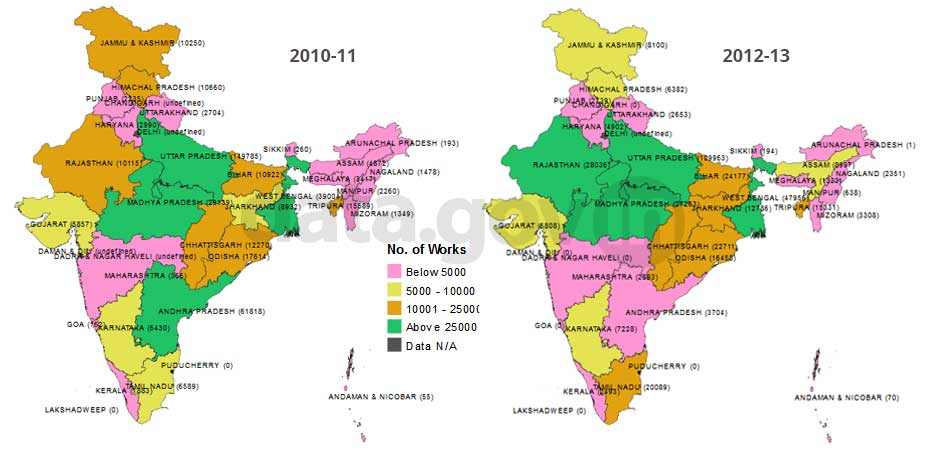
Total Works Taken-up under MGNREGA (State-wise) from 2010-11 to 2012-13 Total Works Taken-up under MGNREGA (State-wise) from 2010-11 to 2012-13
The top 5 States in terms of total works taken-up under MGNREGA in 2012-13 were: Andhra Pradesh with 4666926 works ...
Work (Assets) completed-Rural Connectivity under MGNREGA from 2010-11 to 20 ... Work (Assets) completed-Rural Connectivity under MGNREGA from 2010-11 to 20 ...
The top 5 States in terms of Work (Assets) completed-Rural Connectivity under MGNREGA in 2012-13 were: Uttar Prades ...
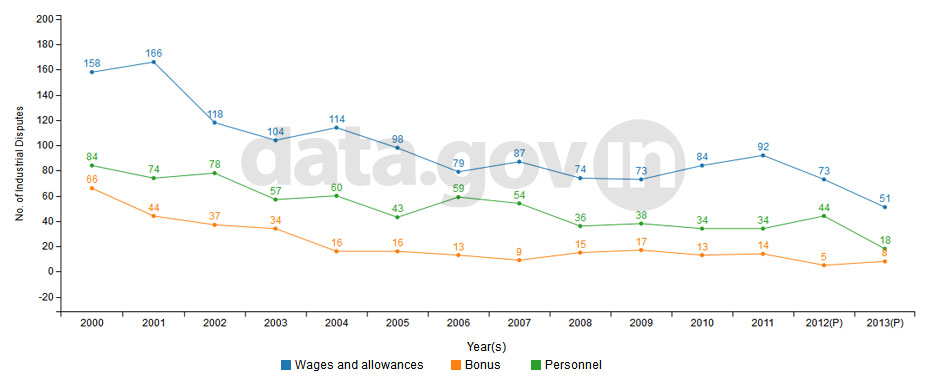
Top Three Causes of Industrial Disputes in 2013 Top Three Causes of Industrial Disputes in 2013
The total number of industrial disputes in the year 2013 was 194. The top three causes of industrial disputes in th ...
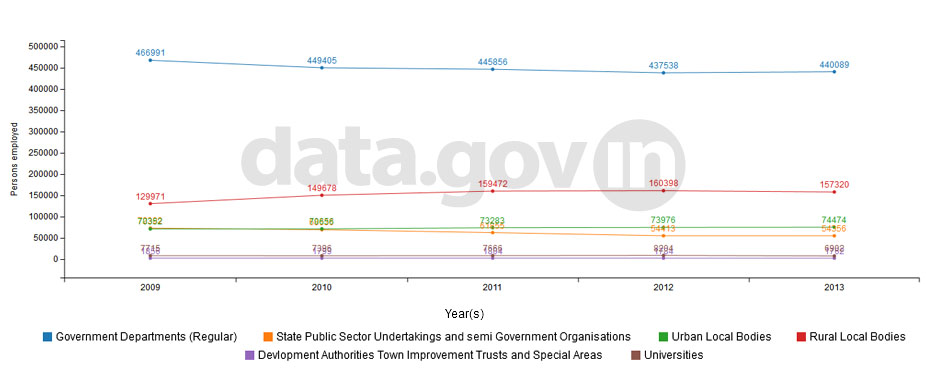
Sector wise Employment in Madhya Pradesh from 2009 to 2013 Sector wise Employment in Madhya Pradesh from 2009 to 2013
The employment in Government Departments (Regular) decreased from 466991 in 2009 to 440089 in 2013 showing a decrea ...
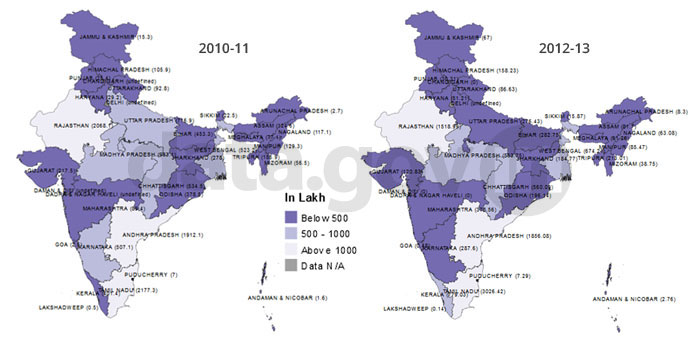
Women Person-days employment generated under Mahatma Gandhi National Rural ... Women Person-days employment generated under Mahatma Gandhi National Rural ...
Mahatma Gandhi National Rural Employment Guarantee Act (MGNREGA) was notified on 7 September 2005 and launched in F ...
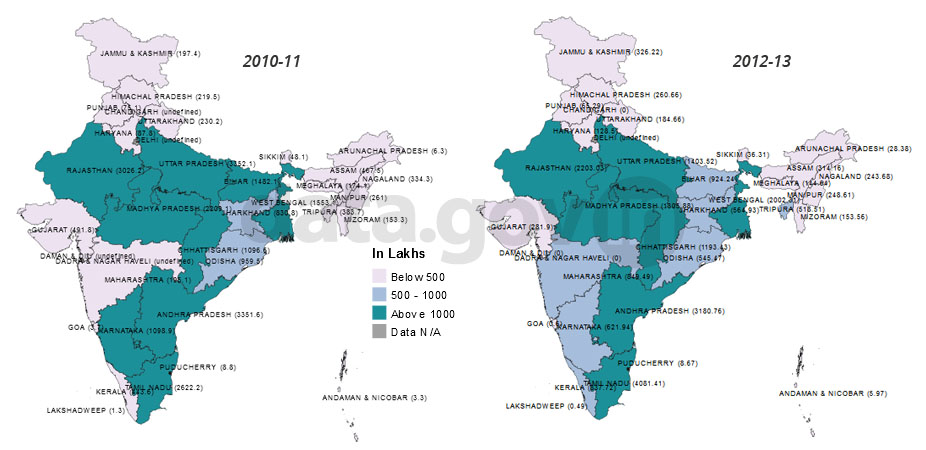
Person-days employment generated under Mahatma Gandhi National Rural Employ ... Person-days employment generated under Mahatma Gandhi National Rural Employ ...
Mahatma Gandhi National Rural Employment Guarantee Act (MGNREGA) was notified on 7 September 2005 and launched in F ...
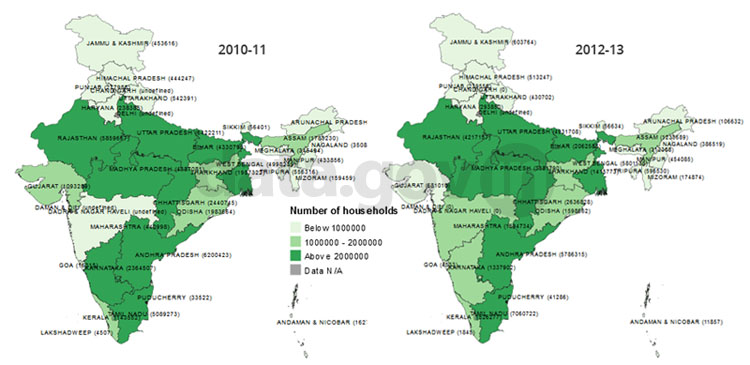
Employment generated under Mahatma Gandhi National Rural Employment Guarant ... Employment generated under Mahatma Gandhi National Rural Employment Guarant ...
The data shows the employment provided to the Rural Households which had demanded work under MNREGA in various year ...
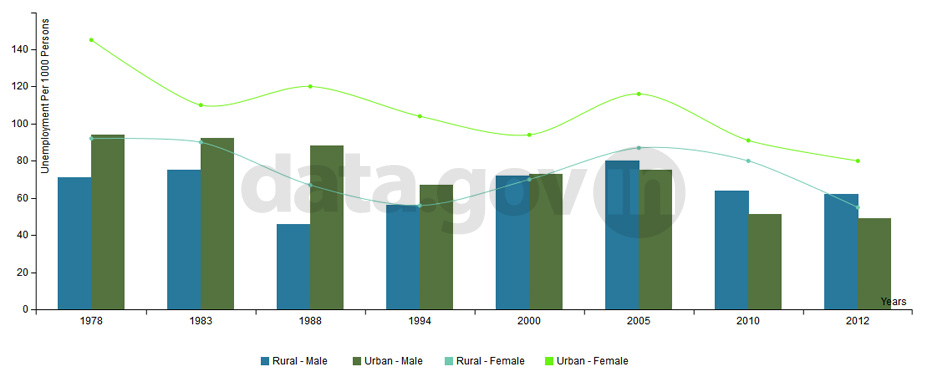
Unemployment Rate According to the Current Daily Status During 1978-2012 Unemployment Rate According to the Current Daily Status During 1978-2012
The International Labour Organisation (ILO) international standard definition of unemployment is based on the follo ...
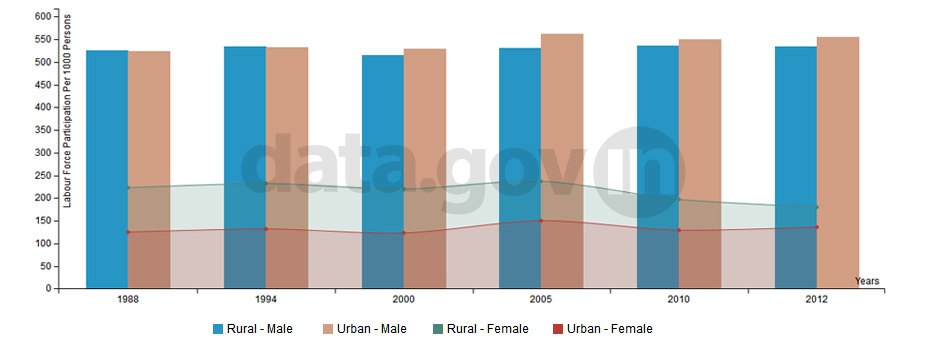
Labour Force Participation Rate According to the Current Daily Status Durin ... Labour Force Participation Rate According to the Current Daily Status Durin ...
Persons who are either working (or employed) or seeking or available for work (or unemployed) during the reference ...