 GOVERNMENT
OF INDIA
GOVERNMENT
OF INDIA
A Digital India Initiative
Please login using your email address as it is mandatory to access all the services of community.data.gov.in
GOVERNMENT
OF INDIA

Motor Vehicles Details in Coimbatore District 2017-18 ...
Details showing the Medical Services available in Coimbatore District in 2017-18 ...
Number of Food and Allied Manufacturing Units in Coimbatore District in 2017-18 ...
Details showing the Number of Mining and Quarrying Units with its Classification-wise Production in Coimbatore District in 2017-18 ...
Details of Statistics showing the Positive, Active, Discharged and Death COVID-19 Cases in Tamil Nadu as on 28.03.2021 ...
Details of Statistics showing the Positive, Active, Discharged and Death COVID-19 Cases in Tamil Nadu as on 27.03.2021 ...
Area under Non-Food Crops (Flowers) by Districts in Tamil Nadu ...
Details of Statistics showing the Positive, Active, Discharged and Death COVID-19 Cases in Tamil Nadu as on 26.03.2021 ...
Area under Non-Food Crops (Edible and Non-Edible Oil Seeds) by Districts in Tamil Nadu ...
Details showing the Head and Branch Libraries, libraries housed in Government / Private Building and number of Reading Rooms in Coimbator ...
Details showing the Legal Services available in Coimbatore District in 2017-18 ...
Details showing the Number of Persons registered and placed through placement in Coimbatore District in 2017-18 ...
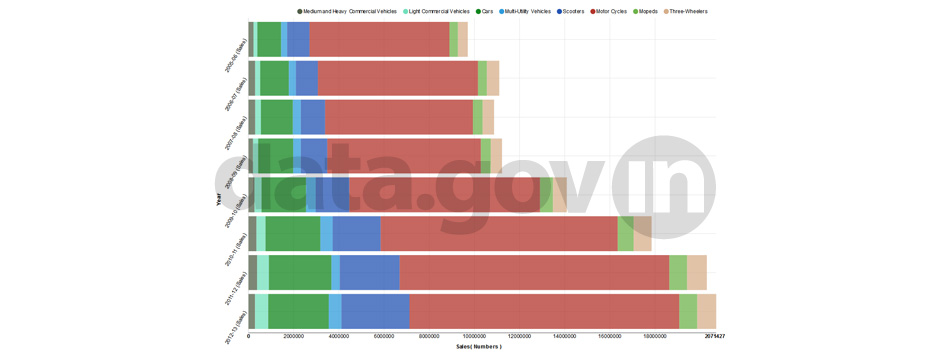
Sales of Motor Vehicles in India Sales of Motor Vehicles in India
Automotive industry, one of the largest industries in India, has been witnessing impressive growth in Sales for las ...
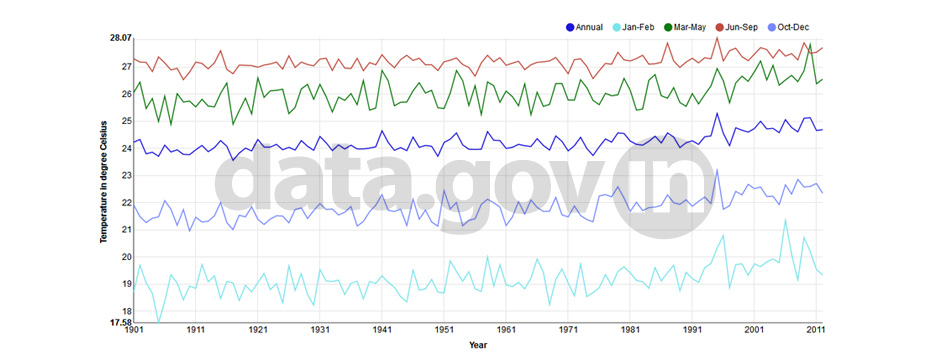
Annual temperature of India shows slightly growing trend since 1901 to 2012, and annual average growth rate of 7 ye ...
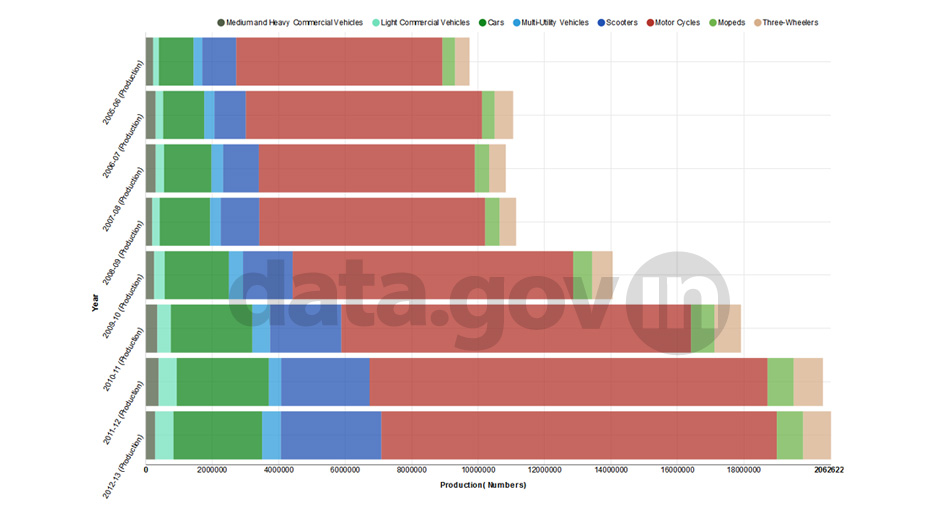
Production of Motor Vehicles in India Production of Motor Vehicles in India
Automotive industry, one of the largest industries in India, has been witnessing impressive growth in production fo ...
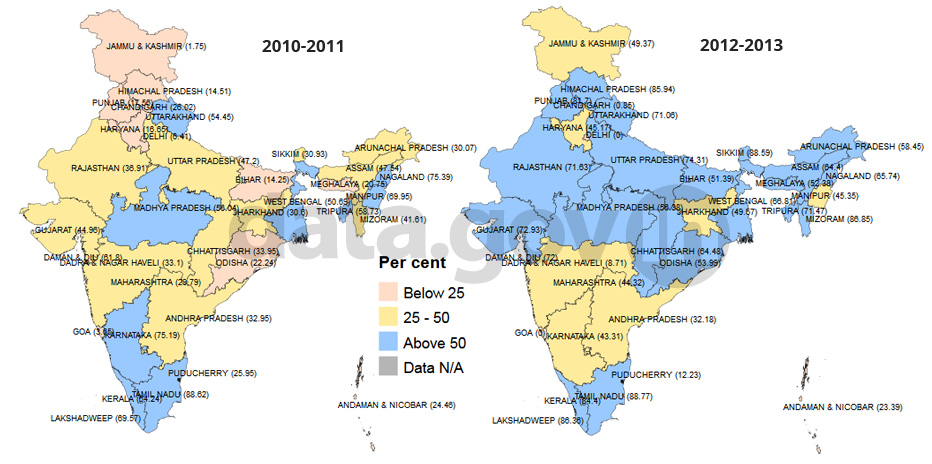
Percentage of Schools having Kitchen-She ... Percentage of Schools having Kitchen-Shed (Government and Aided Managements) ...
Increasing trend has been seen in India in Schools having Kitchen-Shed (Government and Aided Managements) 41.19% in ...
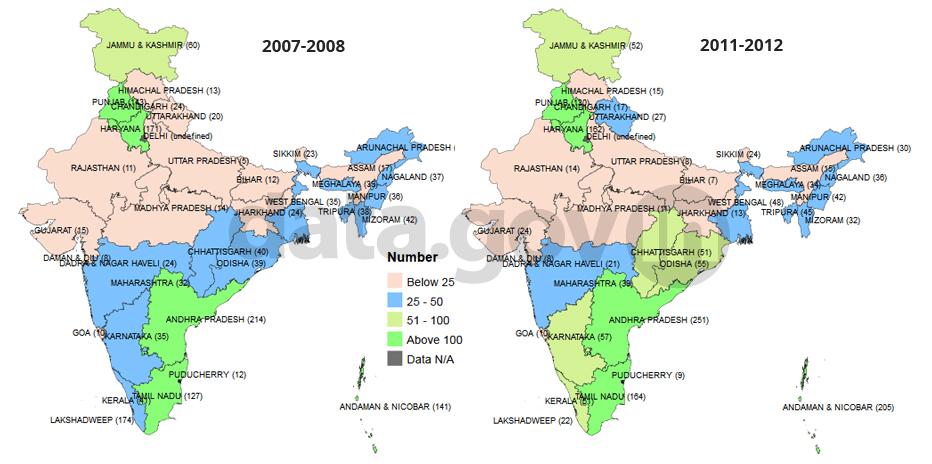
Per Capita Availability of Eggs during 2 ... Per Capita Availability of Eggs during 2007-08 to 2011-12 ...
Increasing trend has been observed in Per Capita Availability of Eggs.It grew by 3% CAGR during 2007-2012. In 2011- ...
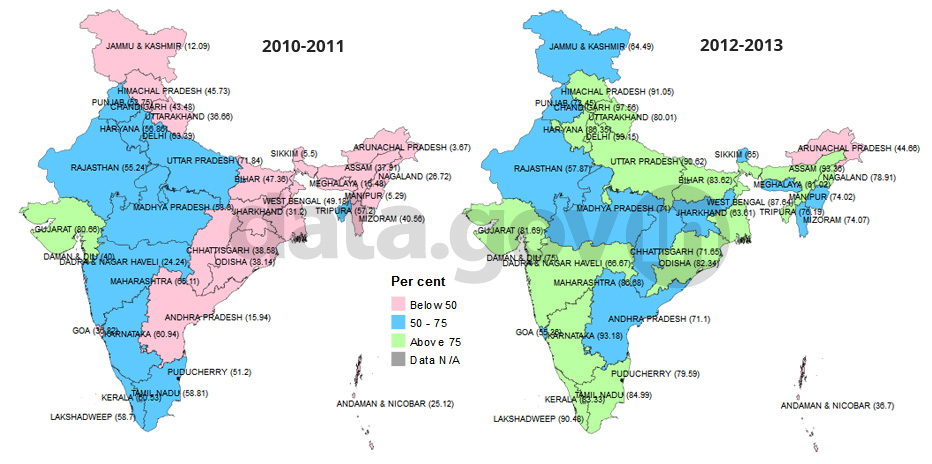
Percentage of Schools having Ramp Percentage of Schools having Ramp
Increasing trend has been seen in India in Schools having Ramp (50.39% in 2010-11 and 79.25 % in 2012-13). Delhi ha ...
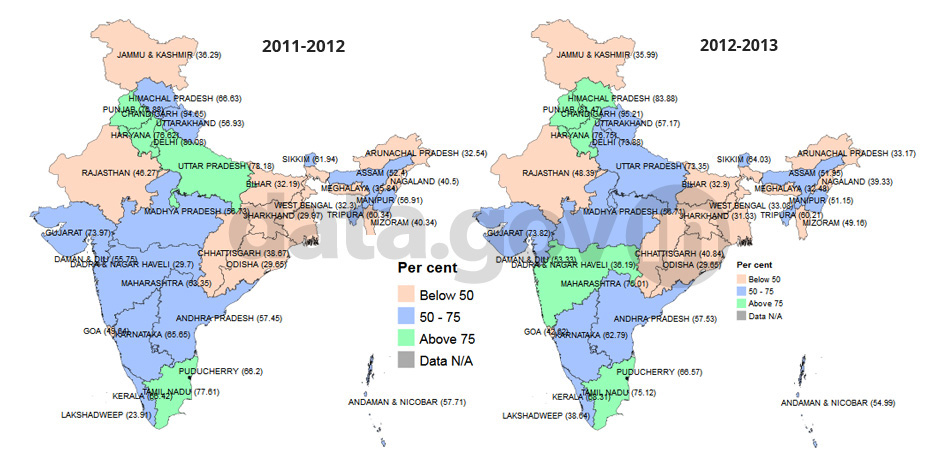
Percentage of Schools having Playground Percentage of Schools having Playground
Increasing trend has been seen in India in Schools having Playground (56.1% in 2011-12 and 56.58% in 2012-13). Chan ...
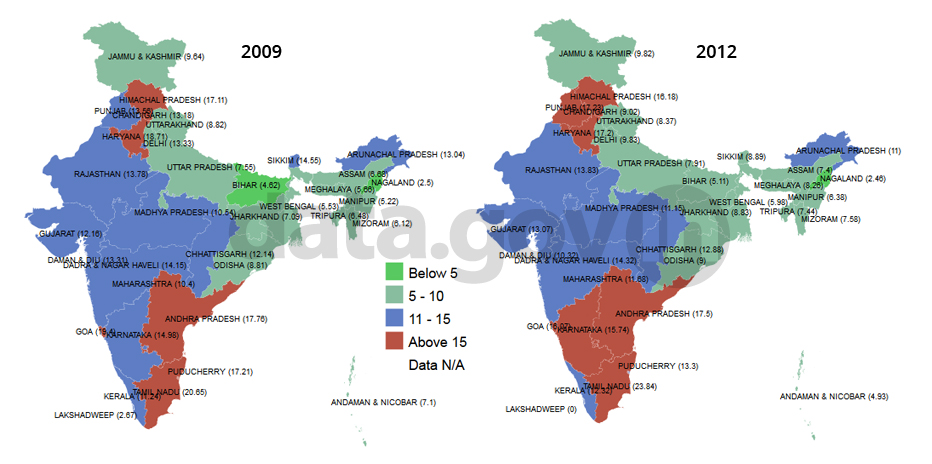
State/UT wise Number of persons killed i ... State/UT wise Number of persons killed in road Accidents per Lakh Population during 2009-2012 ...
During 2012, the number of persons killed in road accidents per lakh of population was highest in Tamil Nadu (23.84 ...
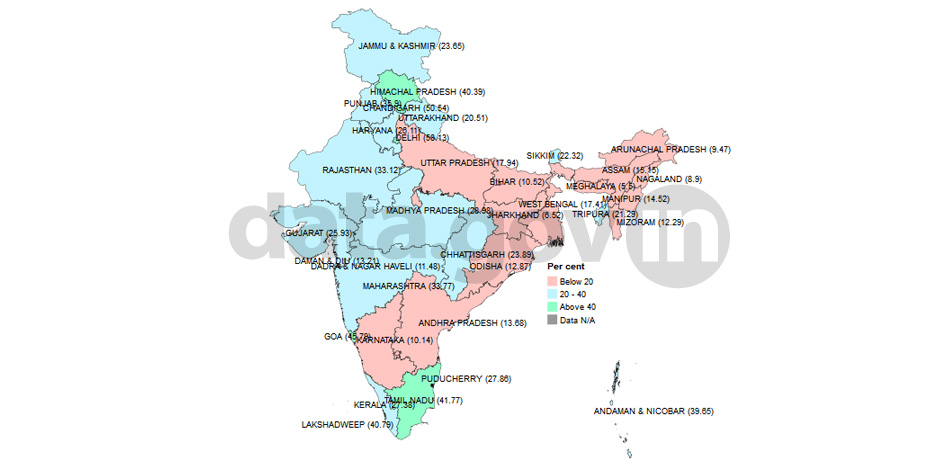
Percentage of Schools Having Hand Wash F ... Percentage of Schools Having Hand Wash Facility ...
Delhi has highest Percentage of Schools Having Hand Wash Facility 58.13% in 2012-13 in comparison to other states. ...
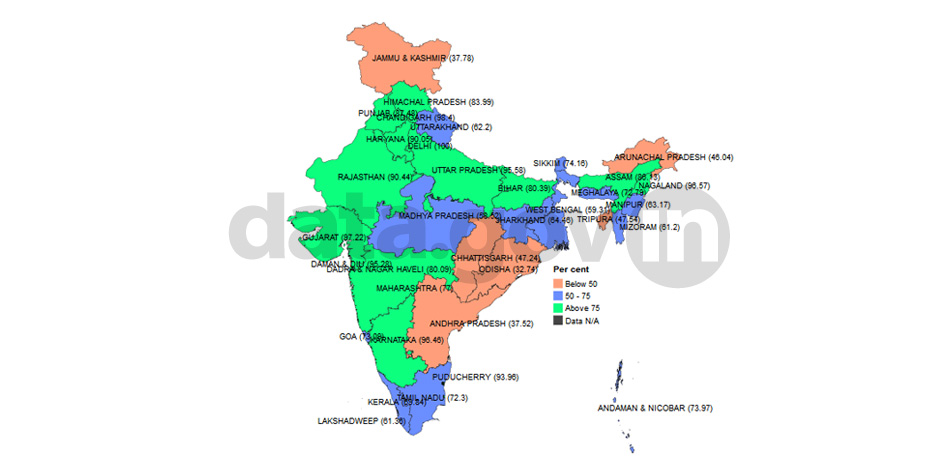
Percentage of Schools having Functional ... Percentage of Schools having Functional Girls Toilet ...
Delhi has highest Percentage of Schools having Functional Girls Toilet 100.0% in 2012-13 in comparison to other sta ...

Percentage of Schools having Enrolment r ... Percentage of Schools having Enrolment rate upto 50 ...
Delhi has lowest percentage of 'Schools having Enrolment rate upto 50' 1.23% in 2010-11 and 1.04% in 2012-13 in com ...
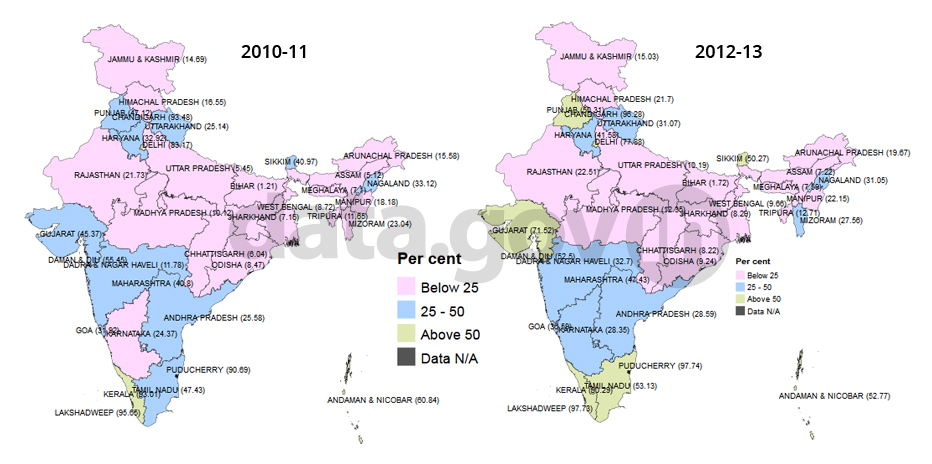
Percentage of Schools having Computer Percentage of Schools having Computer
Increasing trend has been seen in India in Schools having computer (18.7% in 2010-11 and 22.09% in 2012-13). Puduch ...


