 GOVERNMENT
OF INDIA
GOVERNMENT
OF INDIA
A Digital India Initiative
GOVERNMENT
OF INDIA


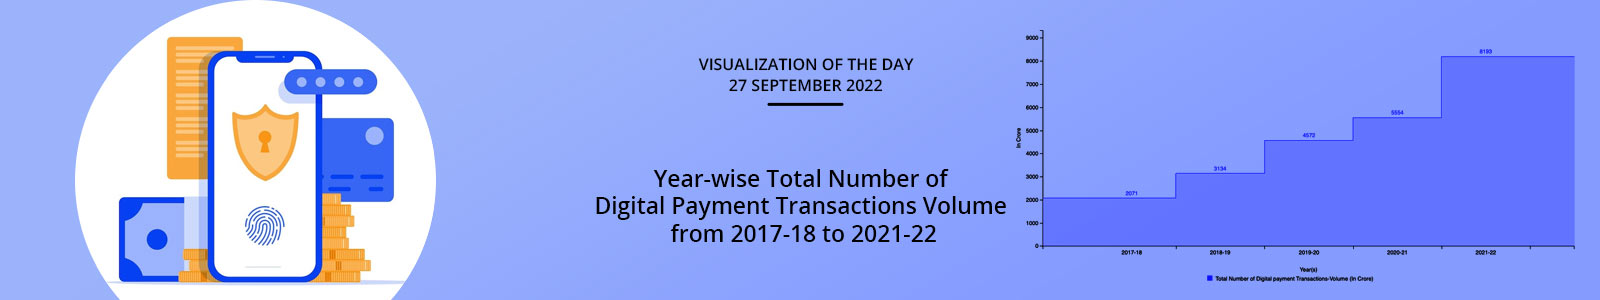
This step chart provides information about the year-wise total number of digital payments undertaken from 2017-18 to 2021-22 (till 20th March 2022). A total of 23,524 crore digital payment transactions were done from 2017-18 to 2021-22. The highest number of 8193 crore digital payment transactions was in 2021-22. The lowest number of 2071 crore digital payment transactions was in 2017-18.
Note: Source – RAJYA SABHA SESSION – 256 UNSTARRED QUESTION No 2652. Data Figures are in Rs. Crore. Data for the Total number of Digital payment transactions-Volume (In Crore) Digital Payments modes considered – BHIM-UPI, IMPS, NACH, AePS, and NETC, Debit cards, Credit cards, NEFT, RTGS, PPI, and others. Data for the year 2021-22(till 20th March 2022) Provisional data. Source – Reserve Bank of India (RBI), National Payments Corporation of India (NPCI) Banks.
Dataset URL: https://data.gov.in/resource/year-wise-total-number-digital-payments-under-taken-2017-18-2021-22#
Resource Title: Year-wise Total Number of Digital Payments under taken from 2017-18 to 2021-22