 GOVERNMENT
OF INDIA
GOVERNMENT
OF INDIA
A Digital India Initiative
GOVERNMENT
OF INDIA


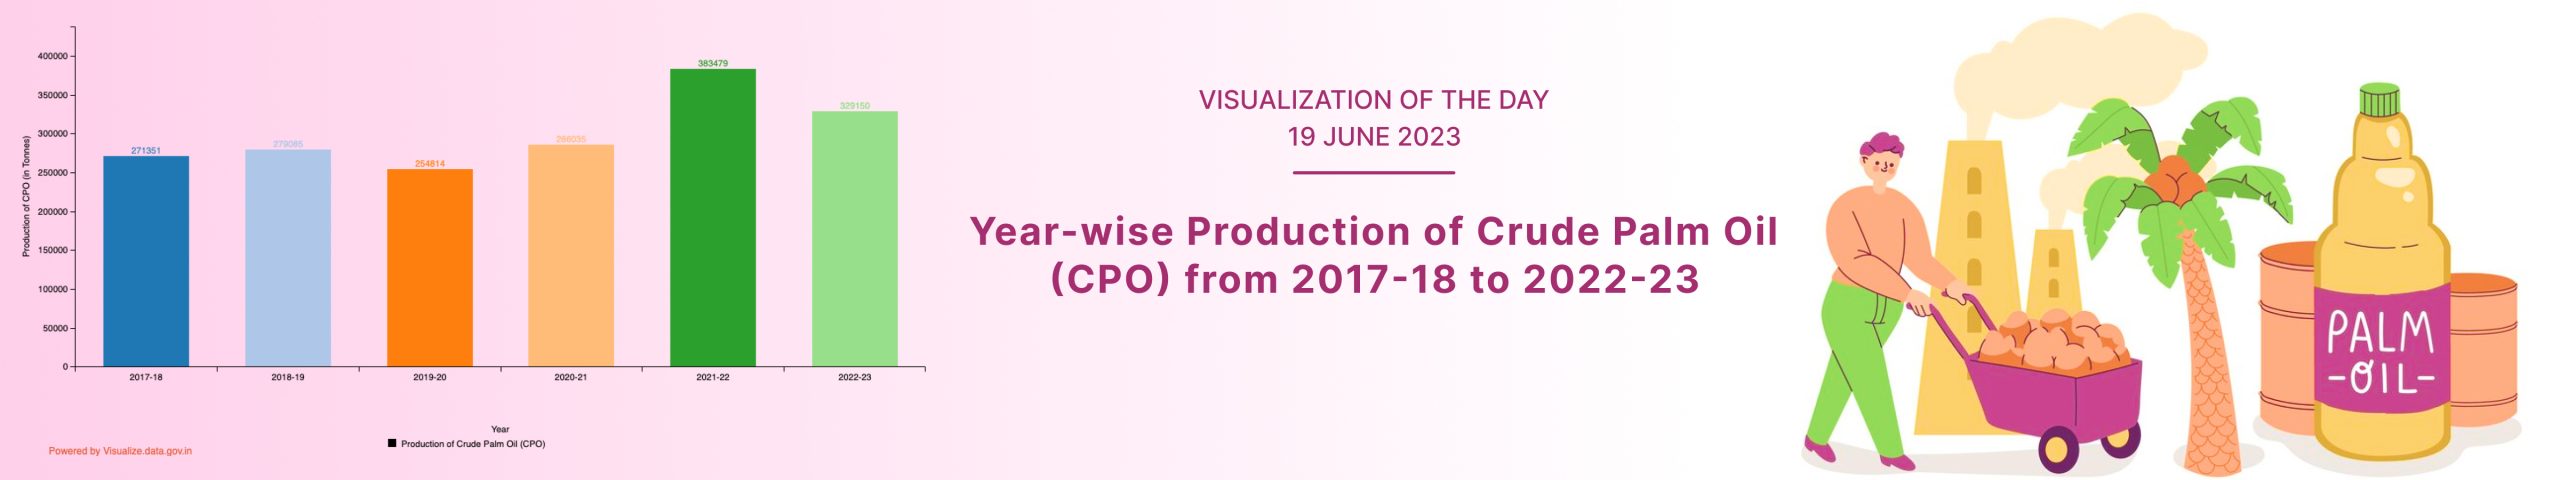
The bar graph represents the year-wise production of crude palm oil (CPO) from 2017-18 to 2022-23 (as on 21-12-2022). The year is shown on the horizontal axis, while the production of CPO (in Tonnes) is represented on the vertical axis. Maximum production of CPO was during 2021-22 having value 3,83,479 tonnes while 2019-20 represents the year of minimum production with a value of 2,54,814 tonnes.
Note: Source – RAJYA SABHA SESSION – 258 UNSTARRED QUESTION No 1930. ANSWERED ON, 23RD DECEMBER 2022. Data Figures are CPO Production in Tonnes. Data for the year 2022-23 (As on 21-12-2022).
Dataset URL: https://data.gov.in/resource/state-wise-production-crude-palm-oil-cpo-2017-18-2022-23
Resource Title: State-wise Production of Crude Palm Oil (CPO) from 2017-18 to 2022-23