 GOVERNMENT
OF INDIA
GOVERNMENT
OF INDIA
A Digital India Initiative
Please login using your email address as it is mandatory to access all the services of community.data.gov.in
GOVERNMENT
OF INDIA


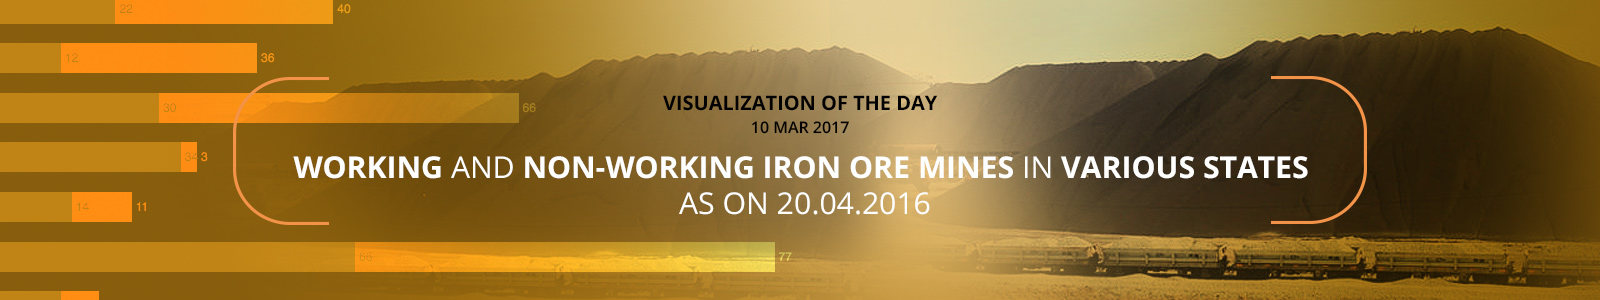
The number of iron ore mines in Andhra Pradesh as on 20.04.2016 was 61. Out of these, the number of working mines was 42, while the number of non-working mines was 19. Thus, the percentage of working mines was 68.85%, while the percentage of non-working mines was 31.15%. The number of iron ore mines in Chhattisgarh as on 20.04.2016 was 18. Out of these, the number of working mines was 16, while the number of non-working mines was 2. Thus, the percentage of working mines was 88.89%, while the percentage of non-working mines was 11.11%.
The number of iron ore mines in Goa as on 20.04.2016 was 62. Out of these, the number of working mines was 22, while the number of non-working mines was 40. Thus, the percentage of working mines was 35.48%, while the percentage of non-working mines was 64.52%. The number of iron ore mines in Jharkhand as on 20.04.2016 was 48. Out of these, the number of working mines was 12, while the number of non-working mines was 36. Thus, the percentage of working mines was 25%, while the percentage of non-working mines was 75%.
The number of iron ore mines in Karnataka as on 20.04.2016 was 96. Out of these, the number of working mines was 30, while the number of non-working mines was 66. Thus, the percentage of working mines was 31.25%, while the percentage of non-working mines was 68.75%.
The number of iron ore mines in Madhya Pradesh as on 20.04.2016 was 37. Out of these, the number of working mines was 34, while the number of non-working mines was 3. Thus, the percentage of working mines was 91.89%, while the percentage of non-working mines was 8.11%. Madhya Pradesh had the highest percentage of working mines as on 20.04.2016.
The number of iron ore mines in Maharashtra as on 20.04.2016 was 25. Out of these, the number of working mines was 14, while the number of non-working mines was 11. Thus, the percentage of working mines was 56%, while the percentage of non-working mines was 44%. The number of iron ore mines in Odisha as on 20.04.2016 was 143. Out of these, the number of working mines was 66, while the number of non-working mines was 77. Thus, the percentage of working mines was 46.15%, while the percentage of non-working mines was 53.85%. Odisha had the highest number of total mines as well as working mines as on 20.04.2016.
The number of iron ore mines in Rajasthan as on 20.04.2016 was 19. Out of these, the number of working mines was 12, while the number of non-working mines was 7. Thus, the percentage of working mines was 63.16%, while the percentage of non-working mines was 36.84%. The number of iron ore mines in Telangana as on 20.04.2016 was 9. Out of these, the number of working mines was 3, while the number of non-working mines was 6. Thus, the percentage of working mines was 33.33%, while the percentage of non-working mines was 66.67%.
Note: Original Source: Indian Bureau of Mines; Source: Rajya Sabha Session – 239 Unstarred Question No. 1230.
Dataset URL: https://data.gov.in/catalog/answers-data-rajya-sabha-questions-session-239
Resource Title: State-wise details of working and non-working iron ore mines as on 20.04.2016 (From: Ministry of Mines)