 GOVERNMENT
OF INDIA
GOVERNMENT
OF INDIA
A Digital India Initiative
GOVERNMENT
OF INDIA


Introduction
The city is seeing increasing number of vehicles plying on the city roads. There are different types of vehicles, which are Buses, Light motor vehicles, Goods carrier vehicles, Two-Wheeler Vehicles, Four-Wheeler Vehicles and Miscellaneous vehicles. There was a need to understand the this trend further to help plan for overall mobility in the city.
Analysis
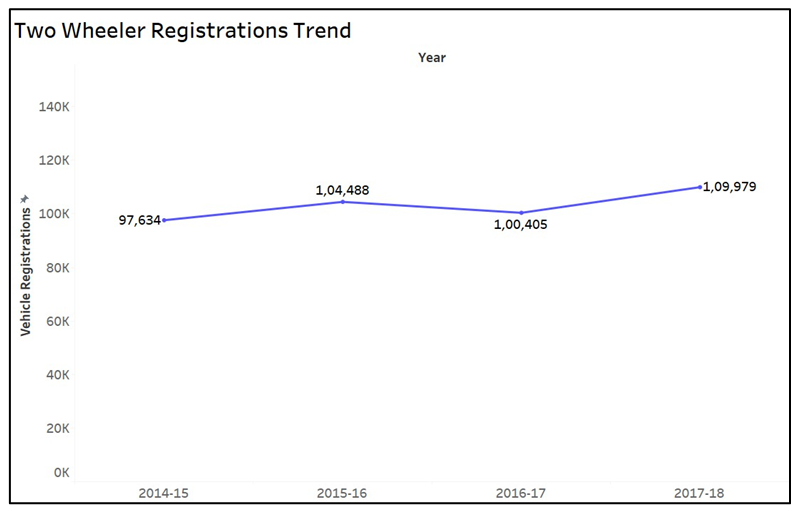
As per the data shared on data.gov.in, Vehicle registrations in Pimpri Chinchwad have an overall increasing trend from 2014-15 to 2017-18. The total vehicle registrations increased by 16.2% in 2017-18 compared to 2014-15. Total 1,26,177 vehicles were registered in 2017-18 in Pimpri Chinchwad.

In spite of the overall increasing trend in total vehicle registrations, registrations of Buses, Light motor vehicles, and Miscellaneous vehicles decreased in 2017-18 as compared to 2014-15, registrations of buses, Light motor vehicles, and Miscellaneous decreased by 33.9%, 4.9%, and 36.8% respectively, in 2017-18 as compared to 2014-15.

However, the registrations of Two-wheelers, Four Wheelers and Goods Carrier Vehicles increased in 2017-18 as compared to 2014-15. If we compare registrations in 2017-18 with the previous year’s registrations (2014-15), Registrations of Four Wheelers increased by 82.5%, Two Wheelers by 12.6%, and Goods carriers by 156.8%. Four wheeler registrations have increased rapidly in last 1 year as compared to Two wheelers, which shows citizens increasing interest in the four-wheeler segment.

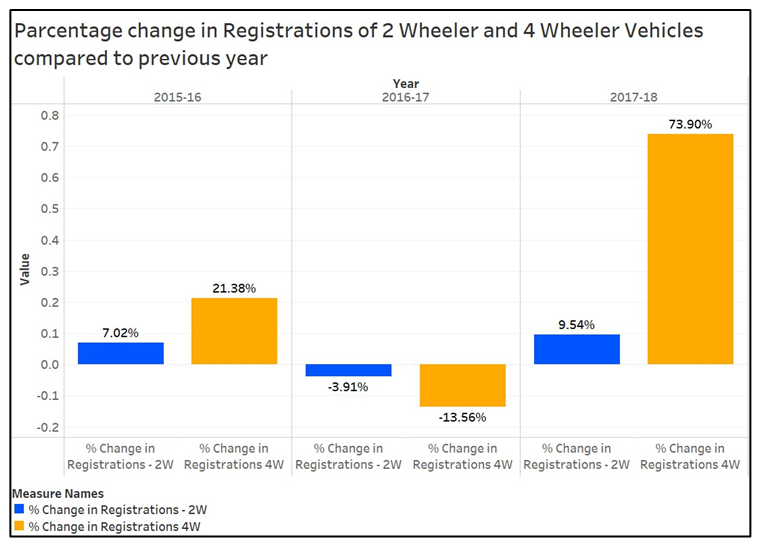
If we look at the chart below, the rate of change in vehicle registrations is high for Four wheelers as compared to Two-wheelers. In 2015-16 two-wheeler registrations increased by 7.02% and 4-Wheeler registrations by 21.38%. In 2016-17 both Two-wheeler and Four-Wheeler registrations were dropped by 3.91% and 13.56% respectively. In 2017-18, Four-Wheeler registrations increased considerably (by 73.9%) as compared to Two-wheelers (9.54%).
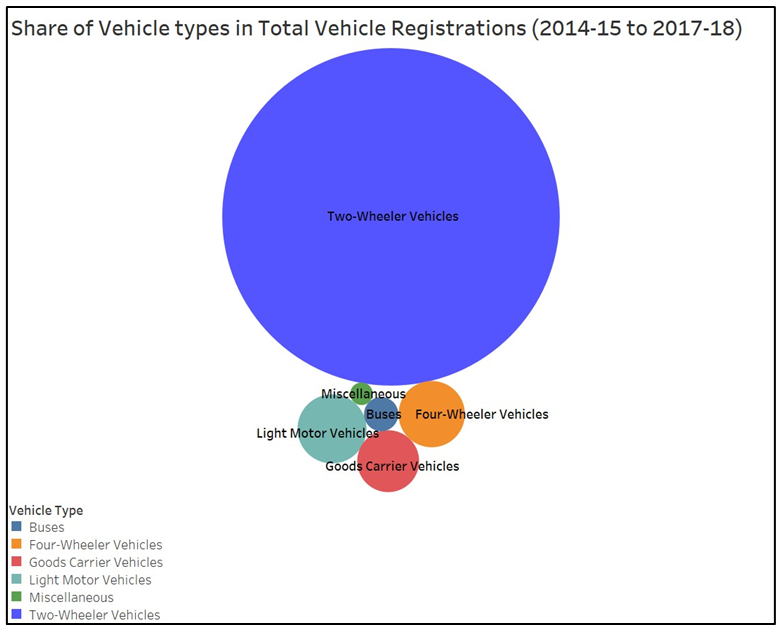
The bubble chart below shows the Percent share of different vehicle types in Total Registrations (2014-15 to 2017-18), Two-wheelers have the highest share of 88.58% followed by Light Motor Vehicles (3.71%) and Four-Wheeler Vehicles (3.42%). Miscellaneous and Buses have the lowest share in total registrations, as 0.40% and 0.91% respectively.
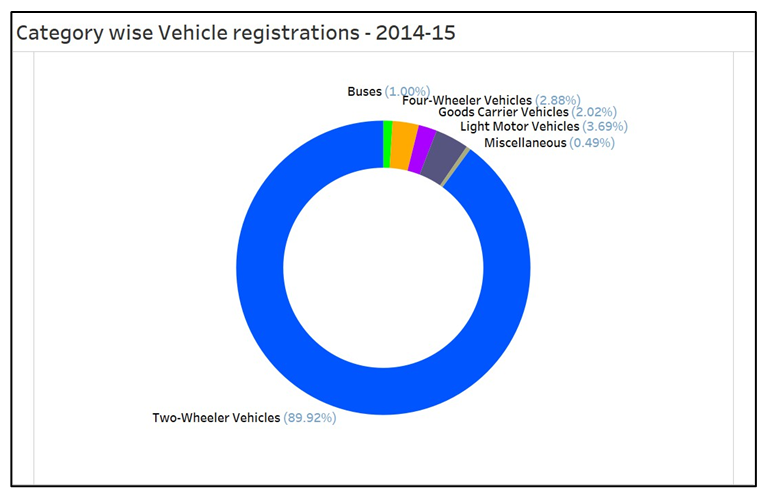
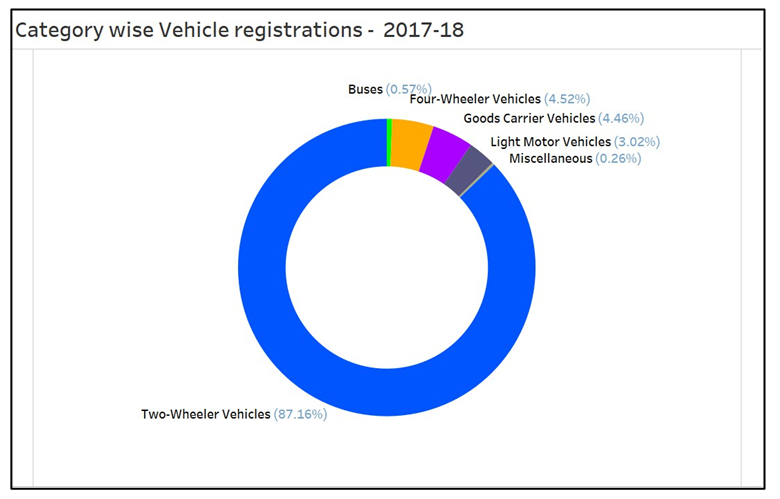
If we see the change in the percent share of different vehicle types in total registrations, the percent share of Two-Wheeler registrations in total registrations has decreased by 2.76 from 2014-15 to 2017-18. Also, the percent share of buses in total vehicle registrations was 1% in 2014-15, which decreased to 0.57% by 2017-18. There are a few types for which the percent share in total registrations went up considerably from 2014-15 to 2017-18 – Four-Wheeler Vehicles and Goods Carrier Vehicles. The percent share of Four- wheeler Vehicles increased by 56.9% in 2017-18 as compared to the percent share in 2014-15, while the percent share of Goods Carrier Vehicles increased by 120.8% in 2017-18 as compared to percent share in 2014-15.
Conclusion
Thus, we can see that the market of Four-Wheeler vehicles and Goods carrier vehicles is increasing rapidly year-on-year, while Two-wheeler vehicles market is increasing slowly as compared to Four-Wheeler Vehicles market. On the other hand Buses and Light Motor Vehicles are struggling to maintain their market share. Based on this analysis, we can see the city is in need of improving the availability of buses for the people and increase the share of public transportation in the city.