 GOVERNMENT
OF INDIA
GOVERNMENT
OF INDIA
A Digital India Initiative
GOVERNMENT
OF INDIA


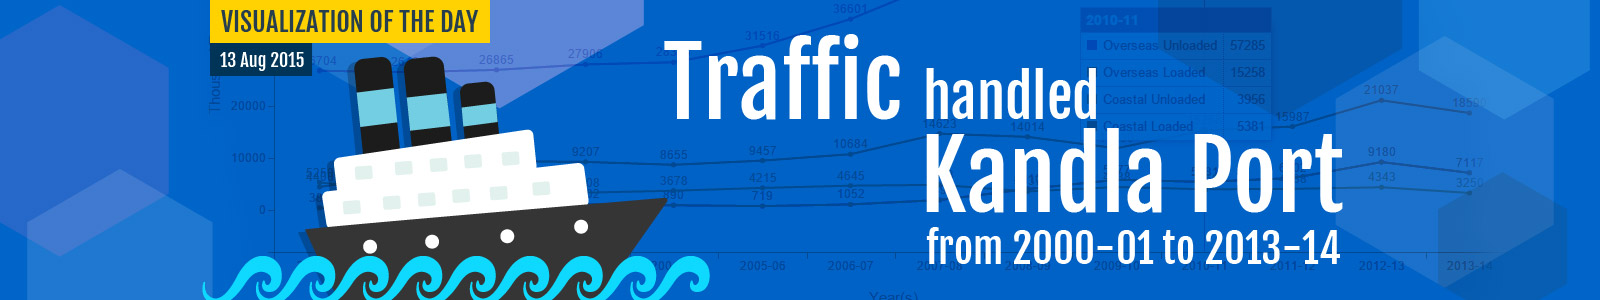
The total traffic handled at Kandla port in 2000-01 was 36741 Thousand Tonnes and it increased to 87005 Thousand Tonnes in 2013-14.
The traffic handled at Kandla port in the Overseas Unloaded category in 2000-01 was 26704 Thousand Tonnes. The traffic handled in Overseas Loaded category in 2000-01 was 4400 Thousand Tonnes. The traffic handled in Coastal Unloaded category in 2000-01 was 5250 Thousand Tonnes. The traffic handled in Coastal Loaded category in 2000-01 was 387 Thousand Tonnes.
The traffic handled at Kandla port in the Overseas Unloaded category in 2001-02 was 26434 Thousand Tonnes. It recorded -1.01% decline over the previous year. The traffic handled in Overseas Loaded category in 2001-02 was 6855 Thousand Tonnes. It recorded 55.8% growth over the previous year. The traffic handled in Coastal Unloaded category in 2001-02 was 3590 Thousand Tonnes. It recorded -31.62% decline over the previous year. The traffic handled in Coastal Loaded category in 2001-02 was 849 Thousand Tonnes. It recorded 119.38% growth over the previous year.
The traffic handled at Kandla port in the Overseas Unloaded category in 2013-14 was 58048 Thousand Tonnes. It recorded -1.71% decline over the previous year. The total growth recorded during 2000-01 to 2013-14 was 117.38%. The traffic handled in Overseas Loaded category in 2013-14 was 18590 Thousand Tonnes. It recorded -11.63% decline over the previous year. The total growth recorded during 2000-01 to 2013-14 was 322.5%. The traffic handled in Coastal Unloaded category in 2013-14 was 3250 Thousand Tonnes. It recorded -25.17% decline over the previous year. The total decline recorded during 2000-01 to 2013-14 was -38.1%. The traffic handled in Coastal Loaded category in 2013-14 was 7117 Thousand Tonnes. It recorded -22.47% decline over the previous year. The total growth recorded during 2000-01 to 2013-14 was 1739.02%.
Note: Figures in (000 Tonnes), Source: Kandla Port 1954-55 to 1956-57 breakup of Loaded & Unloaded Cargo not available.