 GOVERNMENT
OF INDIA
GOVERNMENT
OF INDIA
A Digital India Initiative
Please login using your email address as it is mandatory to access all the services of community.data.gov.in
GOVERNMENT
OF INDIA


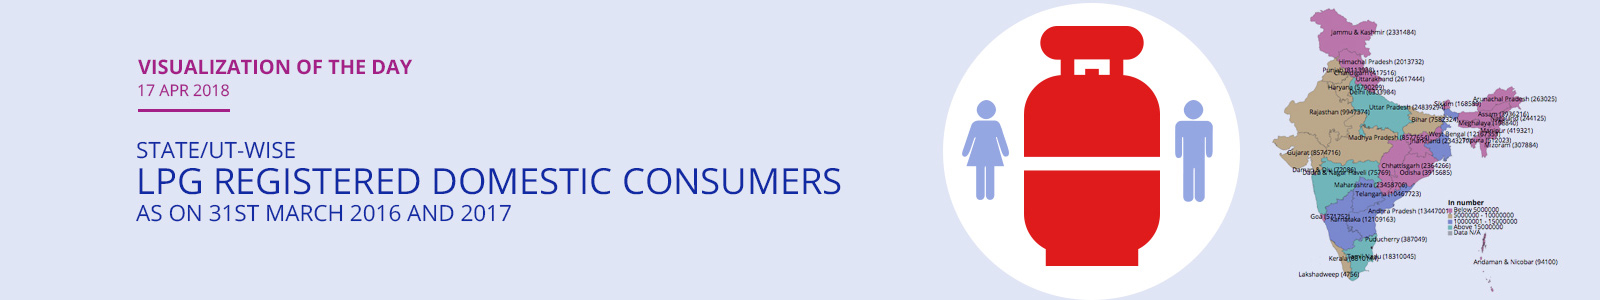
India has witnessed an increasing trend of 16.26% in LPG registered domestic consumers from 201788657 as on 31st March 2016 to 234605271 as on 31st March 2017. The top 5 States/UTs in terms of highest growth rate in LPG registered domestic consumers as on 31st March 2017 above as on 31st March 2016 were; Chhattisgarh, Bihar, Orissa, Uttar Pradesh and Madhya Pradesh.
There were 2364266 LPG registered domestic consumers in Chhattisgarh as on 31st March 2016. We have observed a growth of 51.17% in LPG registered domestic consumers to 3574104 as on 31st March 2017 above as on 31st March 2016 in Chhattisgarh. There were 7582324 LPG registered domestic consumers in Bihar as on 31st March 2016. We have observed a growth of 44.83% in LPG registered domestic consumers to 10981564 as on 31st March 2017 above as on 31st March 2016 in Bihar. There were 3915685 LPG registered domestic consumers in Orissa as on 31st March 2016. We have observed a growth of 32.48% in LPG registered domestic consumers to 5187601 as on 31st March 2017 above as on 31st March 2016 in Orissa.
In Uttar Pradesh there were 24839294 LPG registered domestic consumers as on 31st March 2016. It has increased by 31.07% to 32555722 in Uttar Pradesh as on 31st March 2017 above as on 31st March 2016. In Madhya Pradesh there were 8577654 LPG registered domestic consumers as on 31st March 2016. It has increased by 30.15% to 11163439 in Madhya Pradesh as on 31st March 2017 above as on 31st March 2016.
Note: The figures are (in Number); Source: Central Public Sector Enterprises.
Dataset URL: https://data.gov.in/catalog/indian-petroleum-and-natural-gas-statistics-2016-17
Resource Title: State/ UT and Company-wise LPG Registered Domestic Consumers as on 31st March 2017