 GOVERNMENT
OF INDIA
GOVERNMENT
OF INDIA
A Digital India Initiative
Please login using your email address as it is mandatory to access all the services of community.data.gov.in
GOVERNMENT
OF INDIA


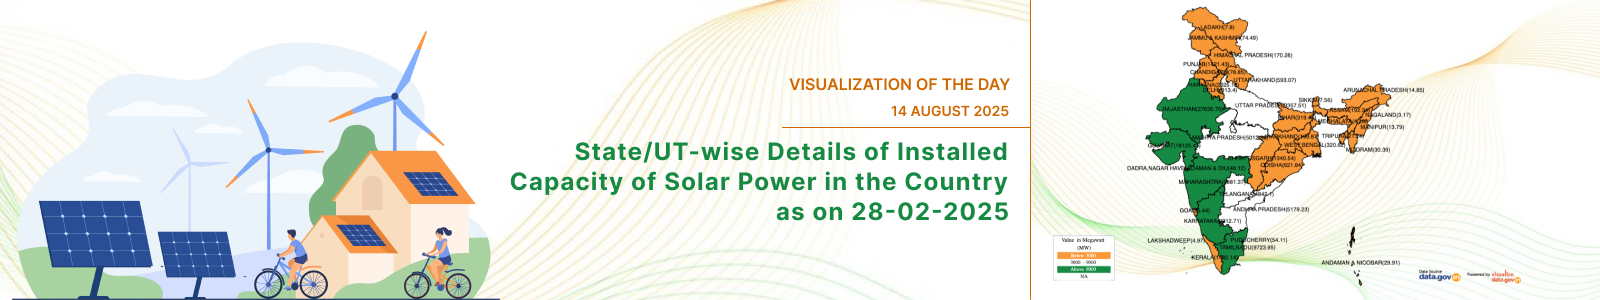
This map chart displays State/UT-wise details of installed capacity of solar power in the country as on 28-02-2025. A total of 7,48,990 Megawatt (MW) of solar power capacity was installed across India as on 28-02-2025. The top 10 States/UTs in terms of installed capacity of solar power were Rajasthan (27,636.75 MW), Gujarat (18,125.41 MW), Maharashtra (9,881.37 MW), Tamil Nadu (9,723.95 MW), Karnataka (9,312.71 MW), Andhra Pradesh (5,179.23 MW), Madhya Pradesh (5,012.88 MW), Telangana (4,842.10 MW), Uttar Pradesh (3,357.51 MW), and Haryana (2,025.18 MW).
Note: Source – RAJYA SABHA SESSION – 267 UNSTARRED QUESTION No. 2069 ANSWERED ON, 18TH MARCH 2025. Data Figures are in Megawatt (MW).
Dataset URL: https://www.data.gov.in/resource/stateut-wise-details-installed-capacity-wind-power-solar-power-and-small-hydro-power-28-02#api
Resource Title: State/UT-wise Details of Installed Capacity of Wind Power, Solar Power and Small Hydro Power as on 28-02-2025 [Data Set]