 GOVERNMENT
OF INDIA
GOVERNMENT
OF INDIA
A Digital India Initiative
Please login using your email address as it is mandatory to access all the services of community.data.gov.in
GOVERNMENT
OF INDIA


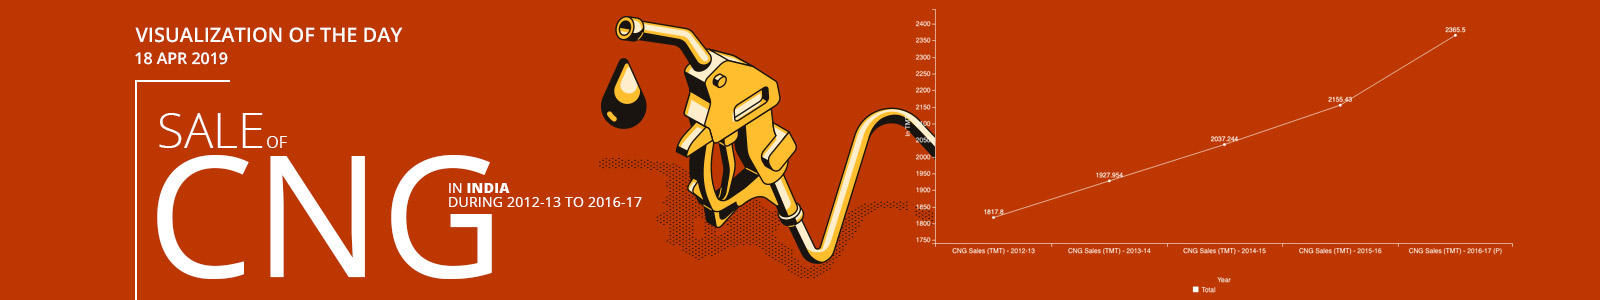
India has witnessed an increasing trend in sale of CNG during 2012-13 to 2016-17. Compound annual growth rate of 6.81% has been observed in Sale of CNG in India during the above said period. Sale of CNG was 1817.8 thousand metric tonnes (TMT) in India during 2012-13. It has increased by 6.06% to 1927.954 TMT during 2013-14 compared to 2012-13. We have seen annual growth of 5.8% in sale of CNG in India during 2015-16 over 2014-15 from 2037.244 TMT. Sale of CNG was 2365.5 TMT in India during 2016-17, up by 9.75% versus 2155.43 TMT during 2015-16.
Maximum annual growth of 9.75% has been found in 2016-17 in sale of CNG in India during the period under consideration.
As on 31st March 2017, the number of CNG stations in India was 1233. There were States/UTs namely Gujarat, Delhi, Rajasthan, Maharashtra, Andhra Pradesh / Telangana, Uttar Pradesh, Tripura, Madhya Pradesh, Haryana, West Bengal, Karnataka and Chandigarh in India which providing CNG sale facility during 2012-13 to 2016-17. The top 3 States/UTs in terms of number of CNG stations as on 31.03.2017; were Delhi, Gujarat and Maharashtra having 421, 396 and 245 stations respectively. The top 3 States/UTs in terms of sale of CNG during 2016-17 were Delhi, Maharashtra and Gujarat having 803.84, 592.59 and 546.31 TMT respectively.
Note: NA: Not Available; *: GAIL Gas is operating in 5 states, Adani Gas in 3 states and BGL & IGL operating in two States. Hence, their number is taken once only; ** : The No. of CNG vehicles for GGL and VGL are based on average no. of vehicles filled at company’s CNG stations per day; Source: Petroleum Planning & Analysis Cell.
Dataset URL: https://data.gov.in/resources/cng-activities-india-31032017
Resource Title: CNG activities in India as on 31.03.2017