 GOVERNMENT
OF INDIA
GOVERNMENT
OF INDIA
A Digital India Initiative
GOVERNMENT
OF INDIA


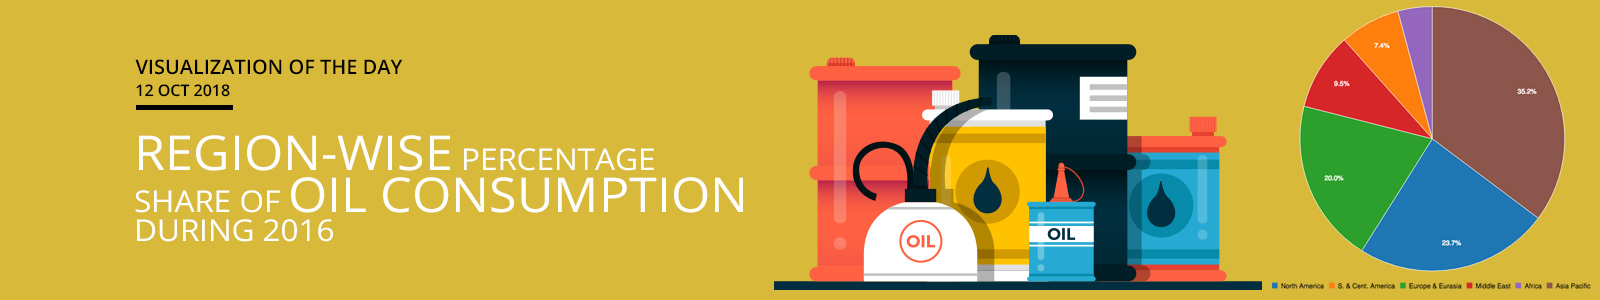
World Oil Consumption was 4085.422 million tonnes during 2010. It has increased by 0.99% to 4125.733 million tonnes during 2011 over 2010. We have observed an annual growth of 1.78% in World Oil Consumption to 4418.248 million tonnes during 2016 versus 4340.957 million tonnes during 2015. In terms of Oil Consumption Asia Pacific region has maximum Percentage share of 35.25% in World Oil Consumption during 2016; followed by North America, Europe & Eurasia, Middle East, S. & Cent. America and Africa region. Annual growth of 3.42% has been seen in Oil Consumption by Asia Pacific from 1505.771 million tonnes during 2015 to 1557.256 million tonnes during 2016.
North America region has Percentage share of 23.7% in World Oil Consumption during 2016. Annual growth of 0.66% has been seen in Oil Consumption by North America region from 1039.994 million tonnes during 2015 to 1046.887 million tonnes during 2016. Europe & Eurasia region has Percentage share of 20.02% in World Oil Consumption during 2016. Annual growth of 2.17% has been seen in Oil Consumption by Europe & Eurasia region from 865.86 million tonnes during 2015 to 884.625 million tonnes during 2016. Middle East region has Percentage share of 9.46% in World Oil Consumption during 2016. Annual growth of 1.22% has been seen in Oil Consumption by Middle East region to 417.836 million tonnes during 2016 versus 412.799 million tonnes during 2015.
S. & Cent. America region and Africa region has Percentage share of 7.38% and 4.2% respectively in World Oil Consumption during 2016. Annual decline of -2.45% has been seen in Oil Consumption by S. & Cent. America region to 326.249 million tonnes during 2016 versus 334.439 million tonnes during 2015. We have observed annual growth of 1.81% in Oil Consumption by Africa region from 182.093 million tonnes during 2015 to 185.395 million tonnes during 2016.
Note: The figures are in Million Tonnes; *: Inland demand plus international aviation and marine bunkers and refinery fuel and loss. Consumption of fuel ethanol and biodiesel is also included; Differences between these world consumption figures and world production statistics are accounted for by stock changes, consumption of non-petroleum additives. and substitute fuels, and unavoidable disparities in the definition, measurement or conversion of oil supply and demand data; Source : BP Statistical Review of World Energy, June 2017.
Dataset URL: https://data.gov.in/catalog/indian-petroleum-and-natural-gas-statistics-2016-17
Resource Title: Country-wise World Oil Consumption from 2010 to 2016