 GOVERNMENT
OF INDIA
GOVERNMENT
OF INDIA
A Digital India Initiative
Please login using your email address as it is mandatory to access all the services of community.data.gov.in
GOVERNMENT
OF INDIA


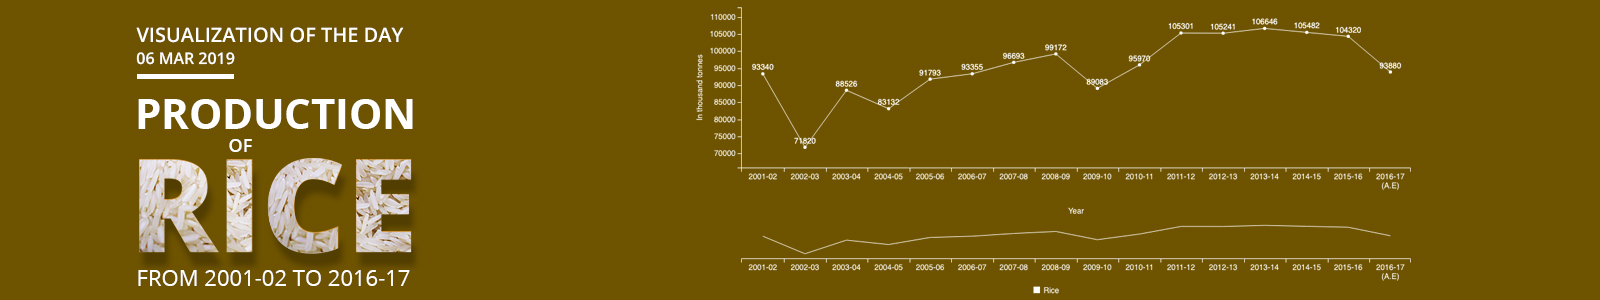
No comprehensible trend is visible in terms of production of Rice from 2001-02 to 2016-17. Rice production was 93340 thousand tonnes during 2001-02. It has decreased by -23.06% to 71820 thousand tonnes during 2002-03 above 2001-02. We have observed annual growth of 9.72% in production of Rice from 95970 thousand tones during 2010-11 to 105301 thousand tones during 2011-12. Production of Rice was 93880 thousand tonnes during 2016-17, down by -10.01% versus 104320 thousand tonnes during 2015-16.
Maximum Rice production of 106646 thousand tonnes was seen in 2013-14 during the period under consideration. Minimum Rice production of 71820 thousand tonnes was found in 2002-03 during the period under consideration. Maximum growth rate of 23.26% has been observed in production of Rice in 2003-04 during the period under consideration.
Note: NA: Not Available; Data values of Production of Natural Rubber are provisional during 2011-12, 2012-13 and 2013-14; Data values of Production of Coffee are provisional during 2012-13 and 2016-17; Data value of Production of Tea is provisional during 2015-16; Data values of Production of Banana, Potatoes, Black Pepper, Chillies, Ginger, Coconut and Turmeric are provisional during 2014-15; Sources: Directorate of Economics and Statistics, Ministry of Agriculture; Tea Board, Coffee Board and Rubber Board, Ministry of Commerce & Industry and also published in Statistical Year Book 2017 by MOSPI.
Dataset URL: https://data.gov.in/resources/all-india-level-production-principal-crops-2001-02-2016-17
Resource Title: All India level Production of Principal Crops from 2001-02 to 2016-17