Home »
Blogs
»
Pimpri Chinchwad: Dashboard for monitoring capital works for smart city
Pimpri Chinchwad: Dashboard for monitoring capital works for smart city
September 27, 2019
Author:
Nilkanth_Poman
Introduction
This initiative was the need of the hour for the Pimpri Chinchwad Municipal Corporation (PCMC) as the current assessment of any project was not being captured by the departments. The departments were capturing details of the projects but in a cluttered fashion on their existing dashboard called as “Probity Dashboard”. This dashboard was the one and only source of validating the project for payment disbursal to the vendors.
The complexity and the need for a dedicated Project Monitoring Dashboard:
- Due to its cluttered form, multiple data points were being recorded in haphazard manner. These data points were not providing the proper picture of the project, its current assessment and the impact it was having on the city.
- Significant time was spent in project review as the HoDs had to prepare extensive presentations each time a review meeting was scheduled.
- It was difficult to ensure that the status report for each ongoing project was being reported. Further, validation of the report too was difficult.
- The indicator to monitor the progress was Physical Progress of the work, which often turned out to be very subjective and inaccurate and there was a need for an objective parameter such as payment milestones which were relatively more accurate in tracking.
- Owing to lack of standardized monitoring parameter, it was difficult to hold accountability for delays.
- Transparency too was a concern as the report was being prepared by the very same people who were to be held accountable for the delay.
- Owing to lack of standardized monitoring parameter, it was difficult to hold accountability for delays.
- Transparency too was a concern as the report was being prepared by the very same people who were to be held accountable for the delay.
Owing to such complexity and volume there was a need to have a monitoring dashboard that could provide real time project status readily available for review of the management
Dashboard Description
“Project Dashboard” is an in-house tool developed for real time monitoring and reporting of all Capital works undertaken by the municipal corporation. The dashboard shows regular real time project status as well as historical updates about projects from the financial year 2007-2008. It is meant for regular use by each department of the corporation that works on capital works. This initiative was taken up to facilitate the implementation of all the projects of the PCMC irrespective of their allocated budget. The objectives of this initiative were:
- Proper Budget Allocation
- Better Project Planning
- Formulation of achievable Millstones
- Precise adherence to Project Timelines
- Offering swift resolution on project facing roadblocks
- Timely payment of invoice raised and its tracking
- Monitoring and tracking of individual projects
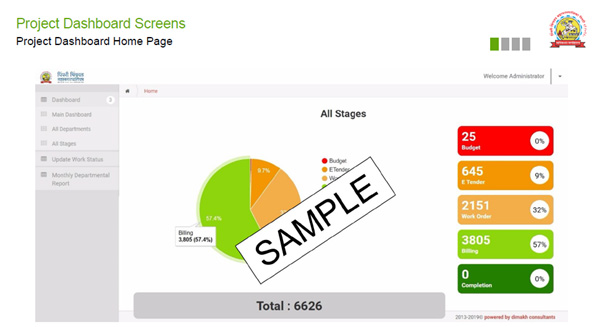
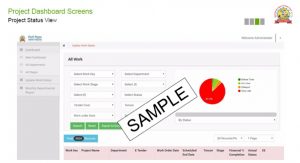
This Project Dashboard helps users get the status of each project, that has been updated as per the financial progress. The dashboard monitors financial progress as opposed to the physical progress which has no actual proof. For example, the dashboard can be primarily used to track the payments made to the vendors and contractors and hence proving the physical completion of each stage, with charts indicating how close or far departments are to meeting their project objectives.
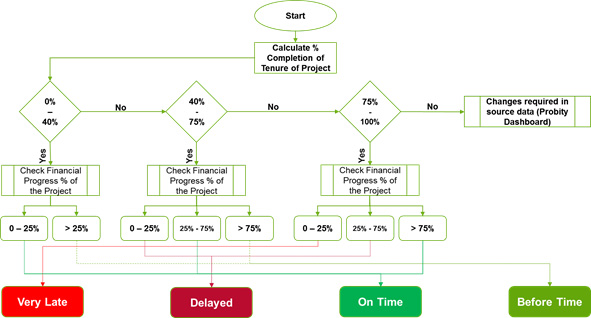
Capital Works Projects’ details such as Work Order, billing details, payment milestones, assigned Executive Engineer, Consultant assigned, etc. being captured in the “Probity Tool” since FY 2007-08, became the base for the Project Dashboard. The entire data from Probity is ported to Project Dashboard using a Java based API. Once the data is imported, the data is sorted, and data cleansing is taken up to remove duplicate/incorrect entries. Next, the data is normalized to make the projects comparable with each other. Once the above is completed, the data is then visualized, and various reports are generated as per the viewer’s requirements. The following flow chart describes the criteria to classify the projects based on the completion with respect to the project payment milestones as per the respective contracts.
Data Migration, Cleansing, Normalization, Visualization and Reporting
- Capital Works Projects’ details such as Work Order, billing details, payment milestones, assigned Executive Engineer, Consultant assigned, etc. were being captured in the “Probity Tool” since FY 2007-08.
- This data became the base for the Project Dashboard. The entire data from Probity is ported to Project Dashboard using a Java based API.
- Once the data is imported, the data is sorted, and data cleansing is taken up to remove duplicate / incorrect entries.
- Next, the data is normalized to make the projects comparable with each other.
- Once the above is completed, the data is then visualized, and various reports are generated as per the viewer’s requirements.
Metrics
- With more than 1,800 Projects across 12+ Departments in PCMC, there was a need to have an online monitoring and reporting tool.
- Further, there was no transparency and accountability over the project status reports being presented.
- The Project Dashboard was developed with a vision to address all such concerns.
- As a part of Phase 1 of the development, all Capital Works Projects being taken up by PCMC are now being monitored in the Project Dashboard.
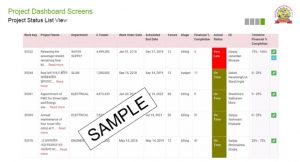
- It provides a real time report on the status of all the projects being monitored with broad classification in Before Time, On time, Delayed & Very Late running of Projects.
- The dashboard takes input data from the Capital Works Projects Billing System – Probity, carries out data normalization, data visualization and generates various reports.
- Owing to regular monitoring of projects using the Project Dashboard, more than 500 “Delayed” Projects are now running “On time” as per their respective project implementation timelines.
Impact
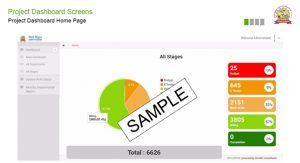
- 1,902 Capital Works Projects are being tracked and monitored using the Project Dashboard as of 3 September 2019
- 500+ Capital Works Projects that were in “Very Late” category, owing to regular monitoring, came under the “On Time” category within a time frame of just six months
- Quick decision-making has been achieved by the administrative leadership by referring to the dashboard rather than waiting to have a full-fledged presentation on each project from every department head
- Improved authenticity of data owing to minimal human intervention in the upload of data in the Project Dashboard, making the process more reliable.
- Improved Accountability: The transparency of the billing processes and systems has also increased which has increased the accountability in the department
- Collaboration between the departments and external stakeholders too has become swift and decisive
Significant aspects
- The “Project Dashboard” initiative is an automated dashboard, i.e., there can be no manual intervention in the dashboard. Any change done in the finalised data sets on Probity (Billing Dashboard) will be reflected on the Project Dashboard. The Project Dashboard considers the financial completion of the project rather than the physical completion as it helps in maintaining the billing cycle of the project.
- Inclusion of Revenue Works Projects can be taken up with minimum effort as the database is already being maintained in “Financial Accounting System” which only needs to be imported in the Project Dashboard to begin the reporting.
- In the Phase II, it is planned to cover all the Capital & Revenue Works Projects of Smart City under the Project Monitoring Dashboard.
- Several additional features such as Project wise progress leader board, engineer wise progress leader board, etc. are already in works.
- The dashboard can be readily replicated for any other organization that has the billing system online.
 GOVERNMENT
OF INDIA
GOVERNMENT
OF INDIA