 GOVERNMENT
OF INDIA
GOVERNMENT
OF INDIA
A Digital India Initiative
Please login using your email address as it is mandatory to access all the services of community.data.gov.in
GOVERNMENT
OF INDIA


Introduction: Kota city is a fast and upcoming educational hub in India and around 2 lakh students come to study in the city. Over the years the city has urbanized and that has led to increase in number of vehicles and enhanced vehicular emissions. It would be interesting to study the air quality levels of the city in the last 2 years to see whether the quality of air has deteriorated or improved. Also, one of the projects picked under Kota Smart City Limited has been Oxy Zone with the idea of providing fresh air and improve the health of its residents. We decided to analyze the pollutant level and monthly variation of pollutants over 18 months on the available data that was collected and loaded in National Open data Portal as sheet under D04 Environment.
Theme chosen for the story is Environment: Kota city has one ambient Air Quality monitoring station near Shrinathpuram Stadium, Jhalawar Road. We used the data from that station as a monitoring tool for entire Kota city representative. This data from July2017 to Dec 2018 was collected and submitted for particulate levels and No2, So2 and O3 levels. We analyzed this data below to develop insights of pollutant levels over time for Kota city, Month to Month variation, Rainfall and Weather impact on the pollutant levels.
Analysis of data:
The team used monthly data from July2017 to Dec2018 of various pollutants and in addition took rainfall data from India Metrology Department for last 5 years to complete the study. The data was plotted in excel and trends were studies for (a) Small and large suspended particulates (b) So2 emission (c) NO2 emissions (d) O3 emissions.
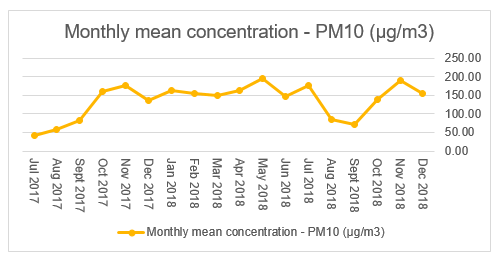
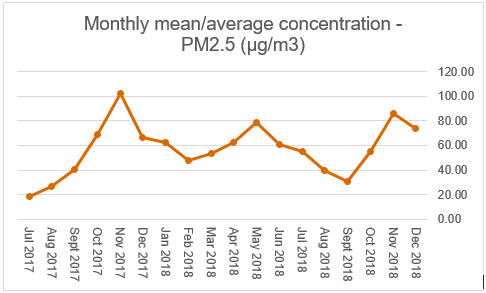
Of these small suspended particulates of PM2.5 are more a signature of vehicular emission and large particulates PM10 are due to mining, construction and power plant emissions.
Key findings: In the month of Nov the level of particulates peaks. This is due to winter weather condition as cold temperature increases this problem. The data was seen in Nov 2017 as well as Nov2018. Also, in 1 year the level has shot up from 18.97ug/m3 to 54.79 ug/m3. Probably due to enhanced vehicular emissions. Rainfall helps in drop in months of July and August months.
Key findings: Large particulates level is lower in July -Sept months as rainfall helps in cleaning the suspended particles. However, as winter proceeds Nov onwards the particulate levels are higher in general. November month peak observed in large particulates.
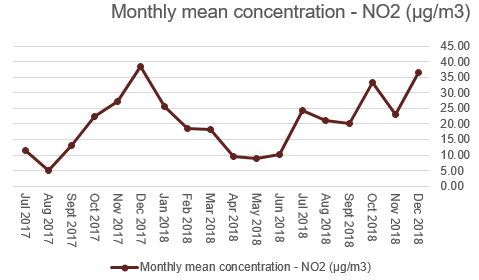
Analysis: December month the No2 particulates peak, due to lower temperature. People may experience more irritation nose and throat in winter months in Kota. Increase is 3.5 times the summer level of NO2. 10ug/m3 level to 35 ug/m3 level.
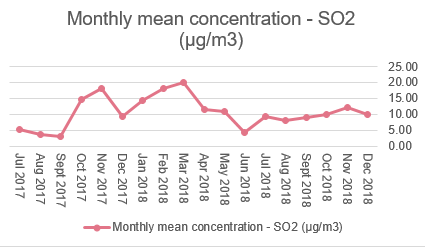
Analysis: In Last 6 months of 2018 the SO2 level have come down of half (20ug level to 10ug level) So looks industrial and power plant emissions of Sulphur based oxides have lowered. This can be further studied.
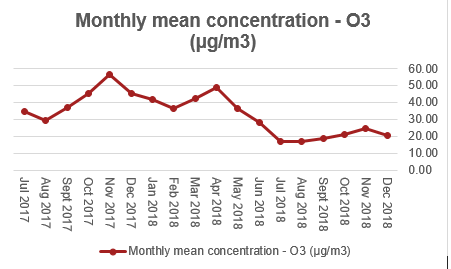
Analysis: In last 6 months of 2018, O3 levels have dropped by 46%. This can be further studied.
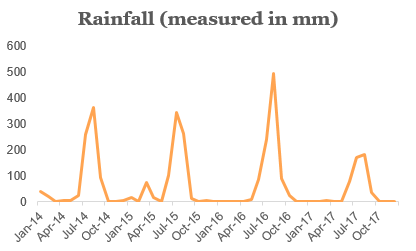
Refer to rainfall graph for details: June July, Aug Sept are months of rainfall for Kota city.
These months both the small and large particulate levels drop due to washing effect of the rain on suspended particulates:
Conclusion: Based on the analysis conducted it was found that Nov month the particulate levels are quite high so initiatives must be taken in city to look at the issue. Two suggestions are made below: