 GOVERNMENT
OF INDIA
GOVERNMENT
OF INDIA
A Digital India Initiative
GOVERNMENT
OF INDIA


![]()
Satna @ Glance:
Satna Municipality area has total spread of 71.46 Sq.Km. The population of satna city is approx 2.80 Lacs. In which Male is approx 1.47 Lacs and Female is approx 1.33 Lacs. The average Literacy rate of satna city is 84.%. It has sufficient quality no. of schools, colleges and University. It has good connectivity which covers all the transport ways e.g Roadways, Railways and Airways. Satna is the limestone belts of India which is also known as the cement hub of India. The city has approx ten cement factories producing and exporting cement to other parts of the country and contributes around 8%–9% of India’s total cement production. City of Satna is known as the commercial capital of Baghelkhand.
Due to all the above reason people outside from the satna are gradually migrating into the city for the purpose of employment, Business and teaching their children and also want to spend quality life in city by on the basis of rental or constructs their own home here. That’s why property increasing in city either giving for rent to outsider or people buying/constructing their own homes.
Selection of Property Tax as a Data Story: Overview
Municipalities gain their authority to levy property taxes from state law. Municipality used property-based taxes to finance most of their activities. Property taxes remain a major source of revenue for local governments, Basic maintenance of your community, the roads you drive on, parks for your morning evening walking/jog through, sewage systems you rely on, and more services could be covered by property taxes.
These Tax do help to pay your government and municipal administrators, as well as keeping up the facilities for them.
There are 45 wards in Satna. Growth on Y-O-Y (Year On Year) basis:-
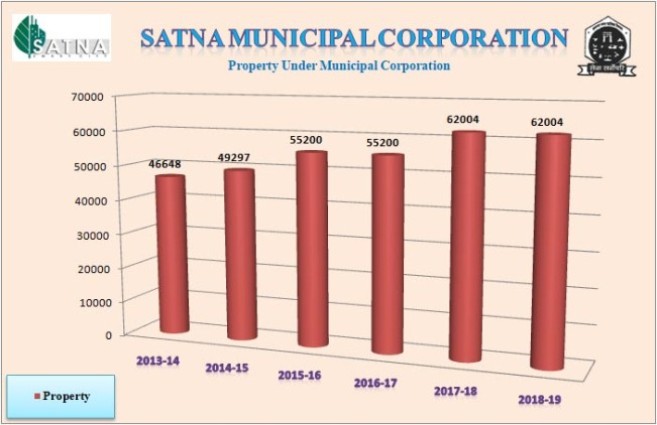
No. Of Property under Municipal Corporation: Chart 1
Years 2013-14 2014-15 2015-16 2016-17 2017-18 2018-19
Property Increase 46648 49297 55200 55200 62004 62004
*Growth Rate for property increasing by 22.21%.
Graph 1:
Property Tax: Chart 2
Years 2013-14 2014-15 2015-16 2016-17 2017-18 2018-19
Demand in Cr. 13.83 15.42 17.87 27.82 34.63 37.53
Collection in Cr. 5.69 5.49 7.68 8.64 13.33 15.71
*Growth Rate for Residential Property tax Demand is 39.81%
*Growth Rate for Residential Property tax collection is 46.01%
Graph 2:

Data Analysis:
In the Graph 1, it is showing that Property growth rate between periods from 2013-14 to 2014-15 was slow but from 2016-17 to 2017-18 the growth rate is good.
Graph 1 also showing that the Migration of outsider to the city increasing rapidly. result is city has to manage all the necessary facility and service like Road, Electricity, adequate water supply, Sanitation, Solid waste management etc. according to citizens.
Graph 2 showing the Property Tax Demand & Collection according to property of city for particular year. According to demands, collections of the taxes against demand are not better and it will affect the services of municipality due to fund issue.
Reason behind the higher Property Tax Demand and low Collection:-
Major Reason behind the higher Property Tax demand is increasing wide area of municipality. Area increased and tax demand is also increased according to area but municipality service like Road, Electricity, adequate water supply, Sanitation, Solid waste management etc. not reached to the citizens. Due to this reasons citizen not ready to pay their property taxes to municipality. Result is lower collection against demand for respective years.
Property tax is major source of fund for any municipality and fund is needed for better management. Right now Satna Municipality has adopted E-Nagarpalika project (State Govt. Project) and in this project municipality has done its property tax collection totally online and gradually the Satna Municipality will collect its tax as fully digitized.
Data Story link:Datastory_Satna Smart City new