 GOVERNMENT
OF INDIA
GOVERNMENT
OF INDIA
A Digital India Initiative
Please login using your email address as it is mandatory to access all the services of community.data.gov.in
GOVERNMENT
OF INDIA


City of Pune is the first city to introduce a city level open data platform and execute Central Government’s Open Data Policy at a Municipal Level. Pune has embarked on the journey of data driven governanceby introducing adata platform that collates the dataexisting in silos, and makes it available on a single, public platform to allstake holders in the ecosystem of city governance.
The City Data Officer (CDO), drives the open data initiative of the Pune Municipal Corporation (PMC). With 450+ datasets available on the Pune Open Data Portalhttp://opendata.punecorporation.org/Citizen/User, PMC’s open data program is established on a strong footing. By deputing a CDO at PMC, Tata Trusts play an important role in facilitating the implementation process.
The Pune open data portal, with its rich datasets, is hitherto an untapped resource. There are very few cases of utilization of this open data for developing public services / propelling innovation and growth in businesses. With this backdrop, the CDO felt the need to:
The Pune Open Data Hackathons were conceptualized to address these needs and gaps. The word “hackathon” is a portmanteau of the words “hack” and “marathon“, where “hack” is used in the sense of exploratory programming, and marathon signifying a long race.
As explained above, the open data hackathon was conceptualized as an event where problems &challenges faced by the citizens are presented to the participants. The hackathon participants are then expected to develop the solution to these problems using the data available on the Pune open data portal. Solutions based on open source tools were encouraged. There were 6 hackathon events conducted at leading educational institutes in Pune. These were conducted as IEEE events. The participants were primarily students from these institutes. The day of the hackathon was conducted like a laboratory session where the students used methods and techniques to extract knowledge and insights from the data in various forms.They worked towards developing solutions for the problem statements. Experienced professionals were available to guide the participants during the session – to generate ideas and steer them towards the right solution approach. The final solutions may not be completed by the teams on the day of the hackathon, which is typically half a day. The participants are then expected to continue their work outside the event and submit it at a predefined date.
| S. No | Date | Educational Institute | Key Domain Areas Addressed |
| 1 | 5-Jan-19 | Symbiosis Institute for C S R (SICSR) | Education |
| 2 | 2-Feb-19 | College of Engineering, Pune (COEP) | Health / Demography |
| 3 | 7-Feb-19 | Symbiosis Institute for C S R (SICSR) | Energy, Census |
| 4 | 9-Feb-19 | SP Pune University, Department of Statistics | Trees, Transport, Education, Energy, Census |
| 5 | 19-Feb-19 | Pune Institute of Computer Technology (PICT) | Transport, Property tax |
| 6 | 25-Feb-19 | Pimpri-Chinchwad College of Engineering (PCCoE) | Health / Demography |
Details of one hackathon event are discussed below, including the outcome.
Problem / Challenge Description:
The Education Department has made available very rich data about the schools on the open data portal. It includes data for the 1200+ schools operational within PMC. And covers the enrollment details for classes 1 to 12 for each academic year from 2012 to 2017. It also has statistics on teaching staff, facilities available at the school and other details regarding the medium of instruction, management category and so on.
Event Plan:
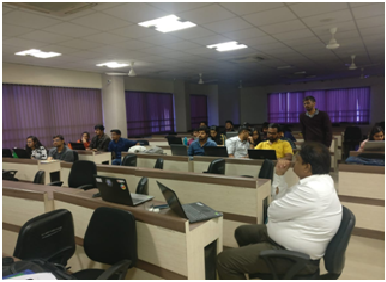
Event Day
Among the five teams that participated in the event, one teamhas completed the geo-spatial mapping of all the schools within PMC. The team has also developed a dashboard for parents (Refer Visual 4). The dashboard is developed in PowerBI and a short project reportpresents the explanation and analysis.