 GOVERNMENT
OF INDIA
GOVERNMENT
OF INDIA
A Digital India Initiative
Please login using your email address as it is mandatory to access all the services of community.data.gov.in
GOVERNMENT
OF INDIA


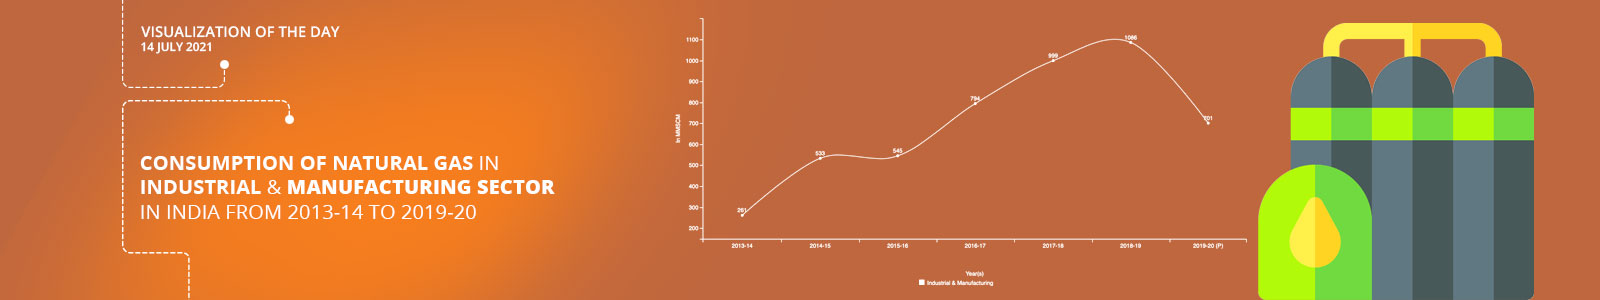
The consumption of natural gas in industrial & manufacturing sector was 261 million metric standard cubic meter (MMSCM) in India during 2013-14. It has surged by 104.2% to 533 MMSCM during 2014-15 above 2013-14. We have observed annual growth of 8.7% in consumption of natural gas in industrial & manufacturing sector in India during 2018-19 from 999 MMSCM during 2017-18. The consumption of natural gas in industrial & manufacturing sector in India was 701 MMSCM during 2019-20, down by -35.5% against 1,086 MMSCM during 2018-19.
Note: Figures are in MMSCM; NA: Not Available; **: Availability Basis (Net Production+LNG Imports); 1. Re-classification among the sectors of consumption of natural gas under energy and non-energy sectors, has been done depending on usage. Sectors where natural gas is being used as feedstock are classified as consumption of gas under non-energy purpose whereas those sectors where natural gas is being used as fuel are classified as consumption of gas under energy purpose; 3. As per IRES, LPG shrinkage is a transformation process and LPG produced is further used for energy purposes to meet domestic / household energy requirements. Therefore, it has been shifted from ‘non energy flow’ to ‘energy flow’; 4. Sector-wise Sales/consumption of natural gas includes RLNG; 5. Total may not tally due to rounding off; 6. The reasons for the variation between the consolidated availability and the consumption can be attributed to stock changes, conversion factor (volume/energy) and the provisional data reported by the companies; Source: PPAC; P: Provisional.
Dataset URL: https://data.gov.in/resources/sector-wise-salesconsumption-natural-gas-2013-14-2019-20
Resource Title: Sector-wise Sales/Consumption of Natural Gas from 2013-14 to 2019-20