 GOVERNMENT
OF INDIA
GOVERNMENT
OF INDIA
A Digital India Initiative
Please login using your email address as it is mandatory to access all the services of community.data.gov.in
GOVERNMENT
OF INDIA


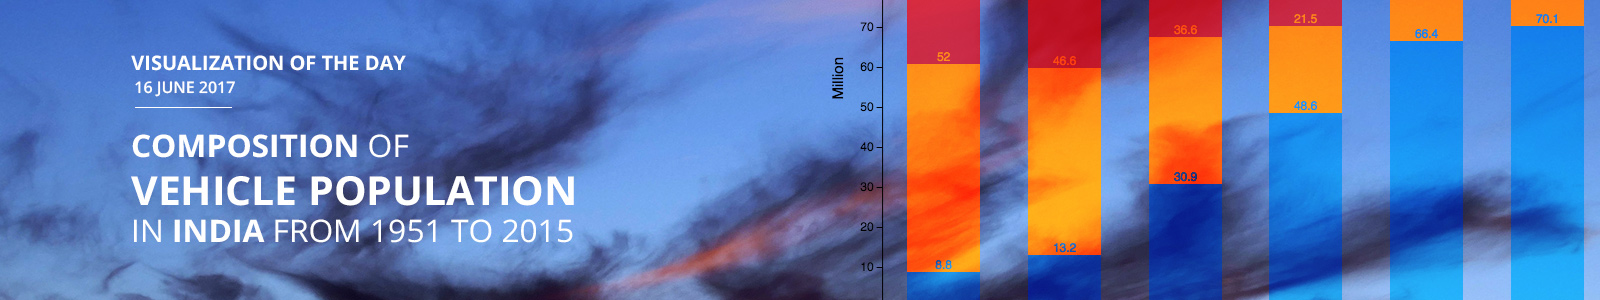
The total vehicle population in 1951 was 0.3 million. It comprised of 8.8% two wheelers, 52% cars, jeeps and taxis, 11.1% buses, 26.8% goods vehicle and 1.3% other vehicles.
The total vehicle population in 1981 was 5.4 million. It comprised of 48.6% two wheelers, 21.5% cars, jeeps and taxis, 3% buses, 10.3% goods vehicle and 16.6% other vehicles. As compared to the year 1951, the share of two wheelers changed by 39.8%, the share of cars, jeeps and taxis changed by -30.5%, the share of buses changed by -8.1%, the share of goods vehicle changed by -16.5% and the share of other vehicles changed by 15.3%.
The total vehicle population in 2001 was 55 million. It comprised of 70.1% two wheelers, 12.8% cars, jeeps and taxis, 1.2% buses, 5.4% goods vehicle and 10.5% other vehicles. As compared to the year 1981, the share of two wheelers changed by 21.5%, the share of cars, jeeps and taxis changed by -8.7%, the share of buses changed by -1.8%, the share of goods vehicle changed by -4.9% and the share of other vehicles changed by -6.1%.
The total vehicle population in 2015 was 210 million. It comprised of 73.5% two wheelers, 13.6% cars, jeeps and taxis, 1% buses, 4.4% goods vehicle and 7.5% other vehicles. As compared to the year 2001, the share of two wheelers changed by 3.40%, the share of cars, jeeps and taxis changed by 0.80%, the share of buses changed by -0.2%, the share of goods vehicle changed by -1% and the share of other vehicles changed by -3%.
Therefore, it can be inferred by the foregoing data analysis, that the composition of vehicle population in India has shown significant variation during the period under consideration i.e. 1951 to 2015. The share of two wheelers has consistently increased; while the share of buses and goods vehicle has consistently decreased. The share of cars, jeeps and taxis decreased in earlier period; but has increased during the period from 2001 to 2015.
Note: Data is as on 31st March of the year. Other vehicles include tractors, trailers, three wheelers (passenger vehicles)/LMV and other miscellaneous vehicles which are not classified separately; For Buses: includes Omni buses since 2001; Source: Offices of State Transport Commissioners/UT Administrations.
Dataset URL: https://data.gov.in/catalog/road-transport-year-book-2013-14-and-2014-15
Resource Title: Composition of Vehicle Population Percentage of India from 1951 to 2015