 GOVERNMENT
OF INDIA
GOVERNMENT
OF INDIA
A Digital India Initiative
Please login using your email address as it is mandatory to access all the services of community.data.gov.in
GOVERNMENT
OF INDIA

Area under Non-Food Crops (Dye Crops) by Districts in Tamil Nadu ...
Area under various Non-Food Crops (Fibre Crops) by Districts in Tamil Nadu ...
Details of Agriculture, Soil Classification, Land Utilization, Regulated Markets, Chemical Fertilizers and Pesticides, Crop Insurance Sch ...
Details of Civil Supplies, Fair Price Shops, LPG Connections, Essential Commodities distributed and their Retail Prices in Coimbatore Dis ...
Banking and Insurance details in Coimbatore District in 2017-18 ...
Details of Statistics showing the Positive, Active, Discharged and Death COVID-19 Cases in Tamil Nadu as on 24.03.2021 ...
Details of Livestock Population, Veterinary Institutions and Hospitals, Dairy Development, Poultry and Fisheries Development in Coimbator ...
Details of Irrigation, Sources of Water Supply, Canals, Tanks and Wells in Coimbatore District in 2017-18 ...
Details of Climate, Normal and Actual Rainfall occurred by Seasons and by Months in Coimbatore District in 2017-18 ...
Area, Population by Broad Industrial Categories, Age Group, Religion and Decennial Growth of Population in Coimbatore District in 2017-18 ...
Area under Non-Food Crops (Miscellaneous Crops) by Districts in Tamil Nadu ...
Details of Statistics showing the Positive, Active, Discharged and Death COVID-19 Cases in Tamil Nadu as on 23.03.2021 ...
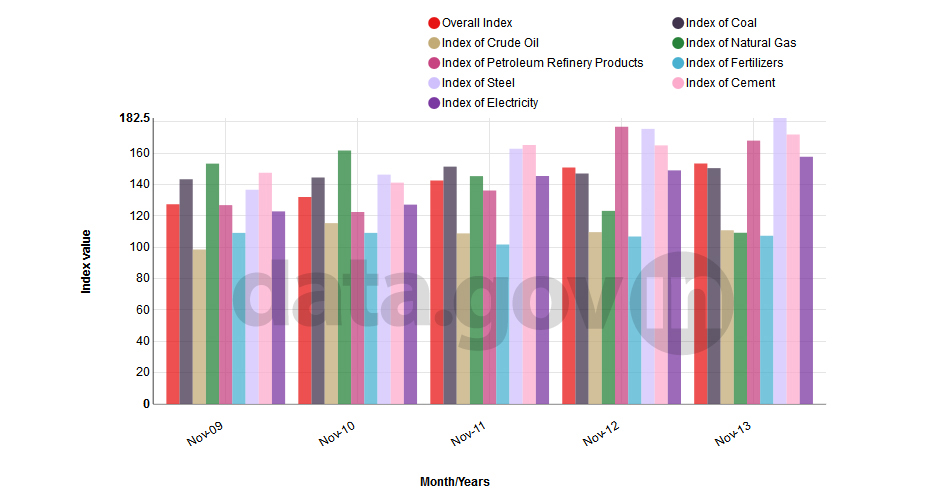
Index of Eight Core Industries (Base Yea ... Index of Eight Core Industries (Base Year 2004-05) (November 2013) ...
The combined Index of Eight Core Industries (base year 2004-05) stands at 153.5 in November, 2013, which was 1.7 % ...
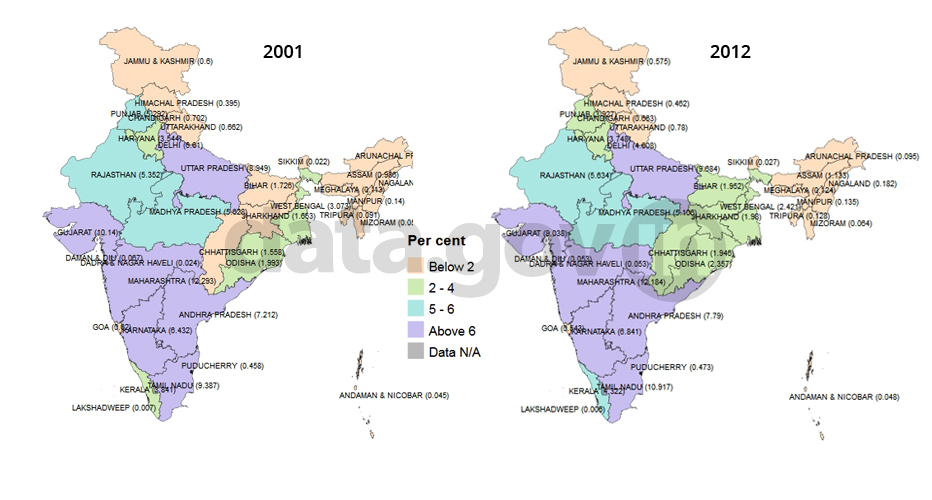
State/UT-wise Percentage Share in Total ... State/UT-wise Percentage Share in Total Registered Motor Vehicles, 2001 and 2012 ...
Maharashtra has highest percentage share 12.184% in total registered motor vehicles in 2012. Lakshadweep has lowest ...
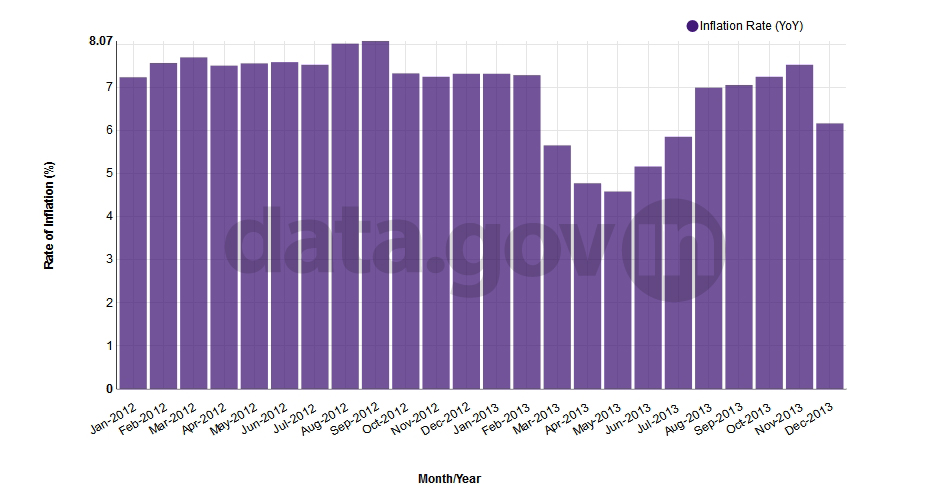
The annual rate of inflation, based on monthly WPI, stood at 6.16% (provisional) for the month of December, 2013 (o ...
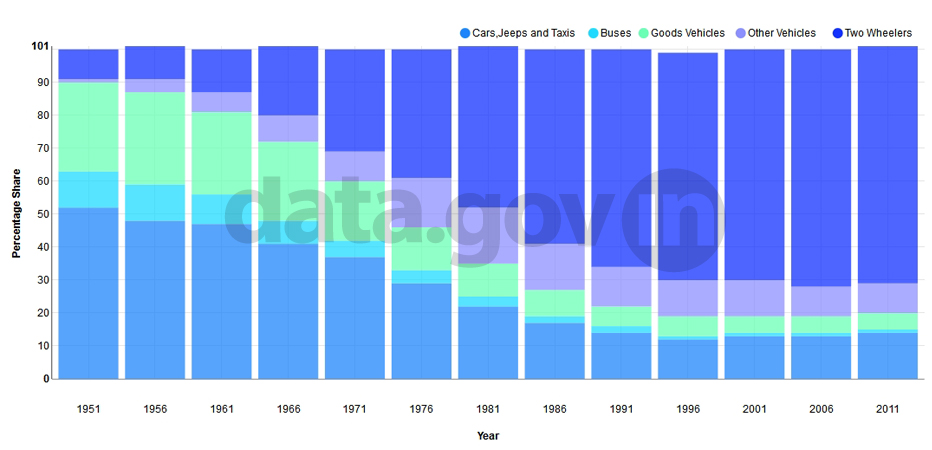
Category wise Registered Motor Vehicles ... Category wise Registered Motor Vehicles in India during 1951-2011 ...
Percentage share of two wheelers in total vehicles had a steep rise between 1951 and 1991. For Two Wheelers no sign ...
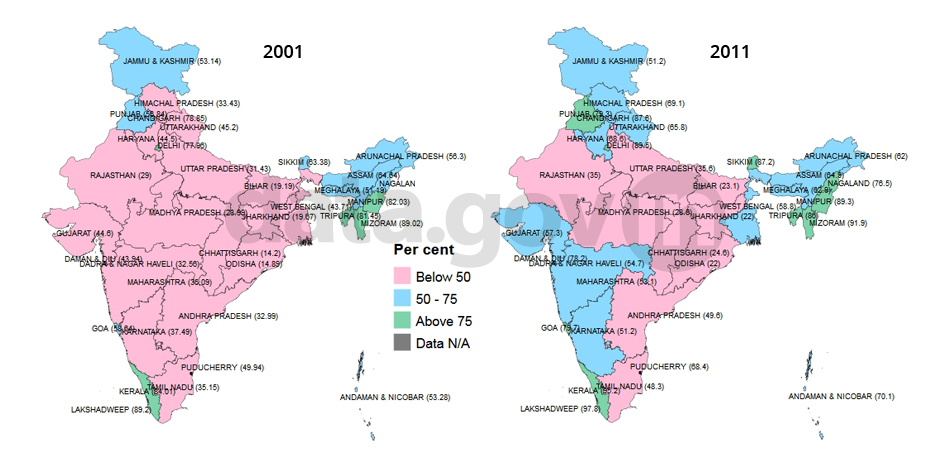
Percentage Distribution of Households Ha ... Percentage Distribution of Households Having Toilet Facilities for 2001 and 2011 ...
Increasing trend has been seen in India in households having toilet facilities (36.41% in 2001 and 46.9% in 2011). ...
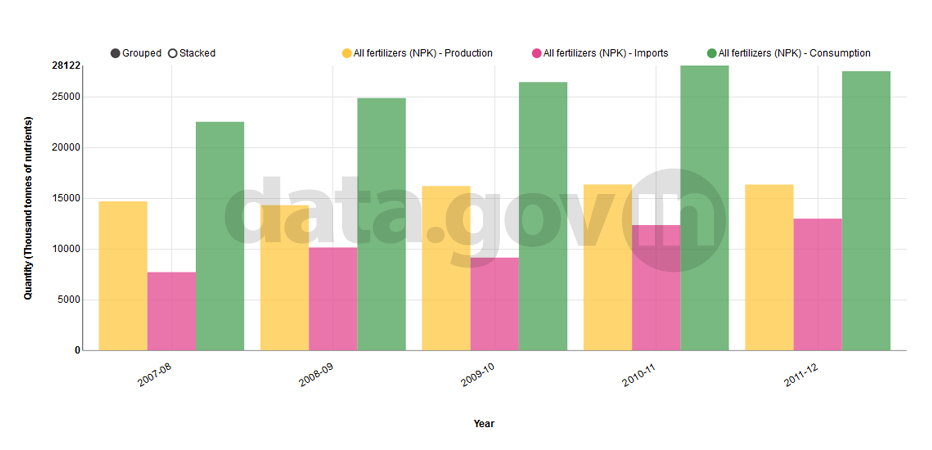
Production, Imports and Consumption of A ... Production, Imports and Consumption of All Fertilizers (NPK) ...
Chemical fertilizers have played an important role in the success of India's green revolution and consequent self-r ...
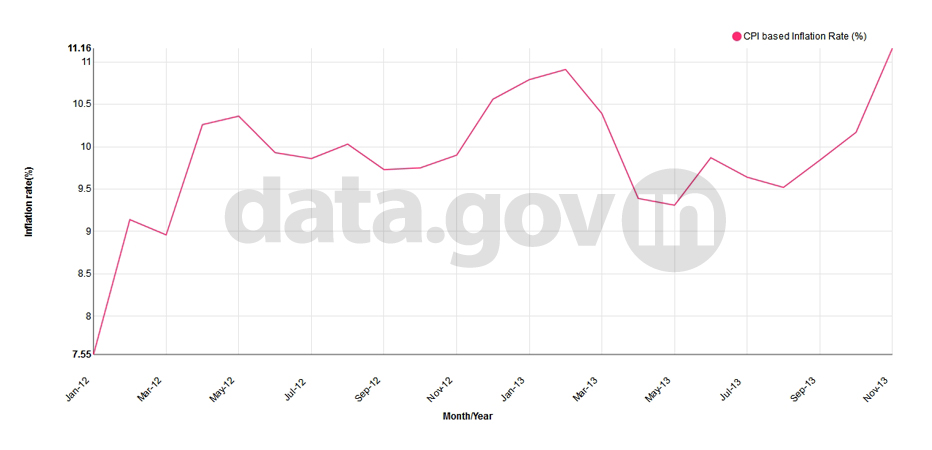
Retail Inflation of India (November 2013) Retail Inflation of India (November 2013)
The Retail Inflation in India, as gauged by the Consumer Price Index (CPI), accelerated to a 23-month high of 11.16 ...
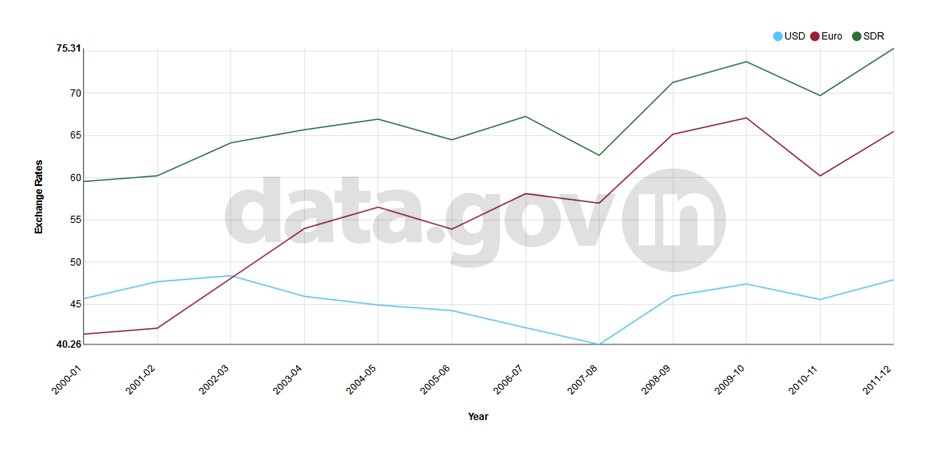
Exchange Rates of Rupee vis-a-vis USD, E ... Exchange Rates of Rupee vis-a-vis USD, Euro and SDR during 2000-01 to 2011-12 ...
In 2007-08, the rupee appreciated to a ten-year high of USD 40.26 and SDR 62.65. During last 5 years, YoY appreciat ...
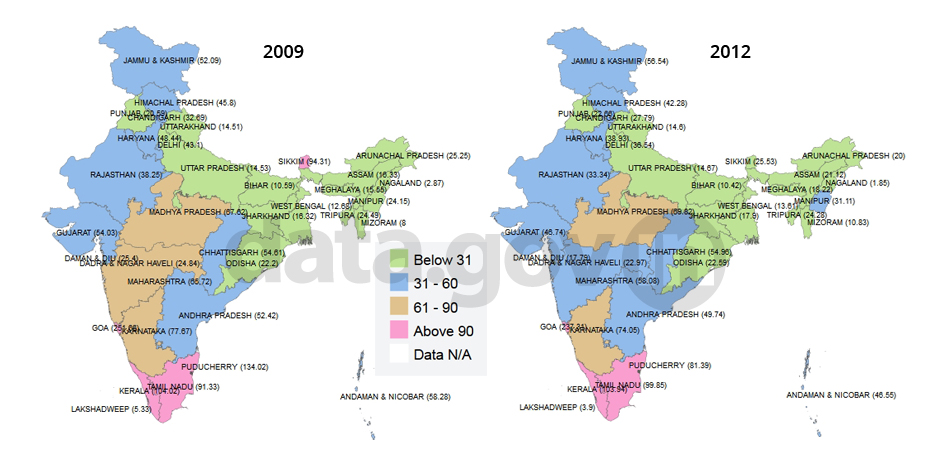
State/UT wise Number of Accidents per La ... State/UT wise Number of Accidents per Lakh Population during 2009-2012 ...
During 2012, the number of road accidents per lakh of population was highest in Goa (237.31), followed by Kerala (1 ...
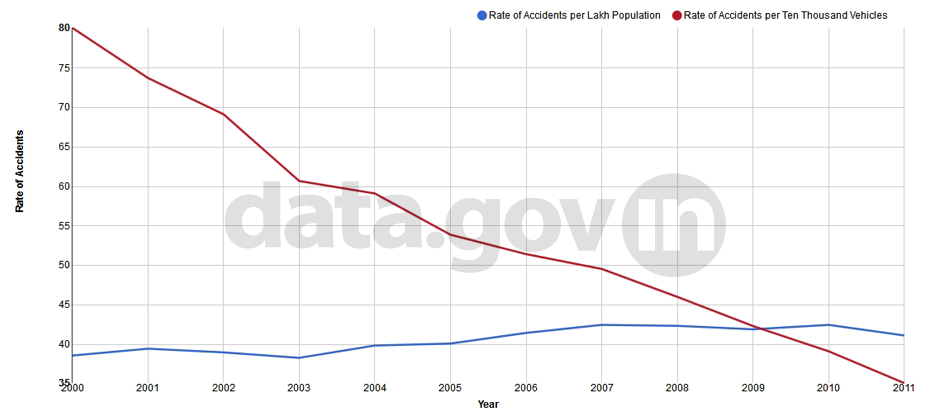
Road Accidents in India during 2001-2011 Road Accidents in India during 2001-2011
During 2001-2011, number of accidents per lakh population has increased at 0.4% CAGR and Number of accidents per te ...
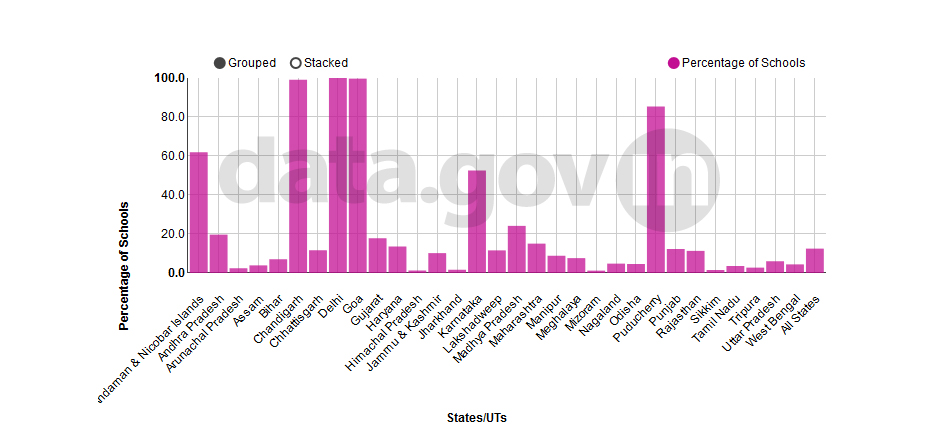
Mid-day Meal Provision 2012-13 Mid-day Meal Provision 2012-13
The chart shows the percentage of schools in various states of India in which under the Mid-day Meal Scheme the mid ...
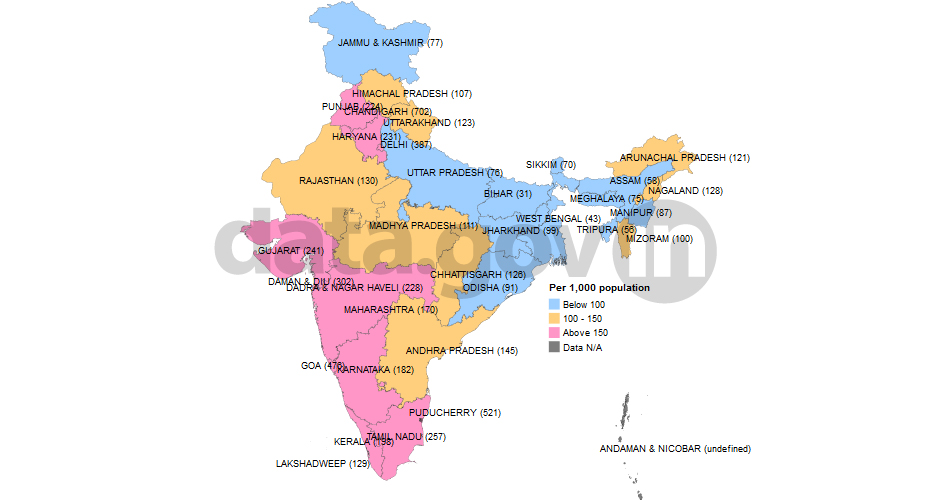
State/UT-wise Registered Motor Vehicles ... State/UT-wise Registered Motor Vehicles Per 1,000 Population in 2011-2012 ...
In 2011-12, Chandigarh with 702 has the highest registered motor vehicles per 1,000 population followed by Puducher ...


