 GOVERNMENT
OF INDIA
GOVERNMENT
OF INDIA
A Digital India Initiative
GOVERNMENT
OF INDIA


The COVID-19 pandemic has thrown normal life into disarray turning routine governance upside down. India, being a developing nation is characterized with rapid urbanization, huge population and high density. Chennai too, being a densely populated city faces additional challenges in controlling the virus spread.
Amidst this chaotic environment, Tamil Nadu’s capital city Chennai has leveraged the use of technology and data to employ one of the largest “Home Quarantine & Isolation Management System (HQMIS)” in the country.
While consensus on the right strategy to combat this pandemic is still under debate, increased testing, robust isolation and quarantine management practices along with early treatment is considered the most effective way to combat COVID-19. Greater Chennai Corporation (GCC), realizing the importance of this three-pronged approach channelized its efforts in all three fronts. While the city boasts one of the highest per capita testing rates and efficient hospital management system, the focus of this blog is on the State of the Art, process driven HQMIS established by the ULB.
Home Quarantine and Isolation Management System (HQIMS)
“HQIMS” in the city was started with the mandate to establish a systematic, process driven monitoring and management system for citizens under Home Quarantine. This was a crucial step in the fight against COVID-19 as this was a shield against the spread of infection. People who had tested positive and did not need hospitalization, contacts of COVID positive patients and citizens who had migrated into the city were placed under home quarantine. On an average over 30,000 citizens are placed and monitored by this system daily.
Working Mechanism
The HQIMS adopts a 5-stage approach to ensure the HQIMS operates at maximum efficiency with minimal leakage.
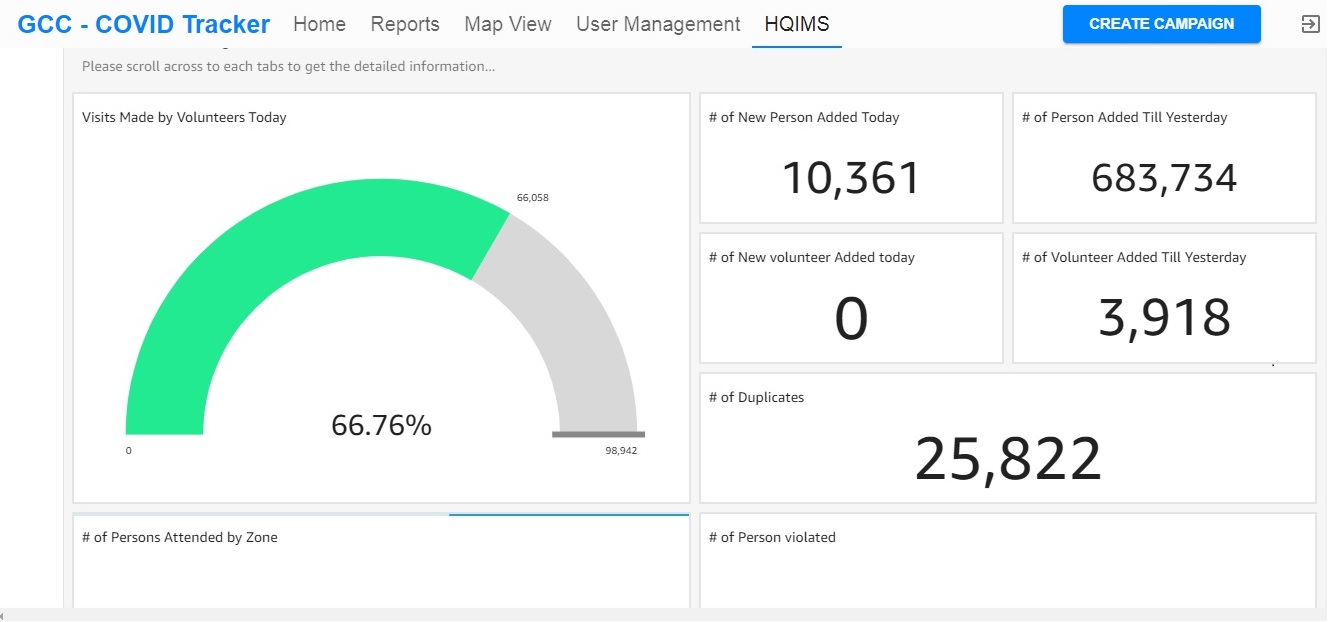
Data Visualization Dashboard
A centralized dashboard, receives and visualizes the data received in real-time, facilitating a closed loop monitoring mechanism. The following are some of the screenshots of the dashboard.
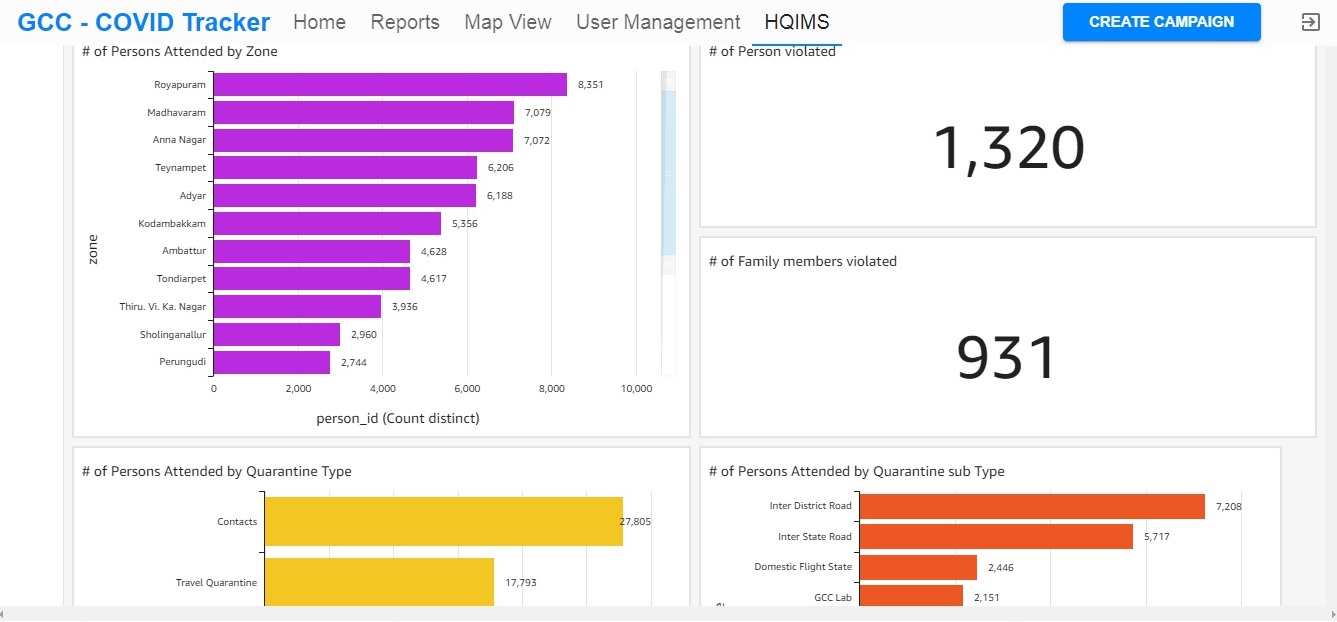
Persons Attended by Quarantine Type
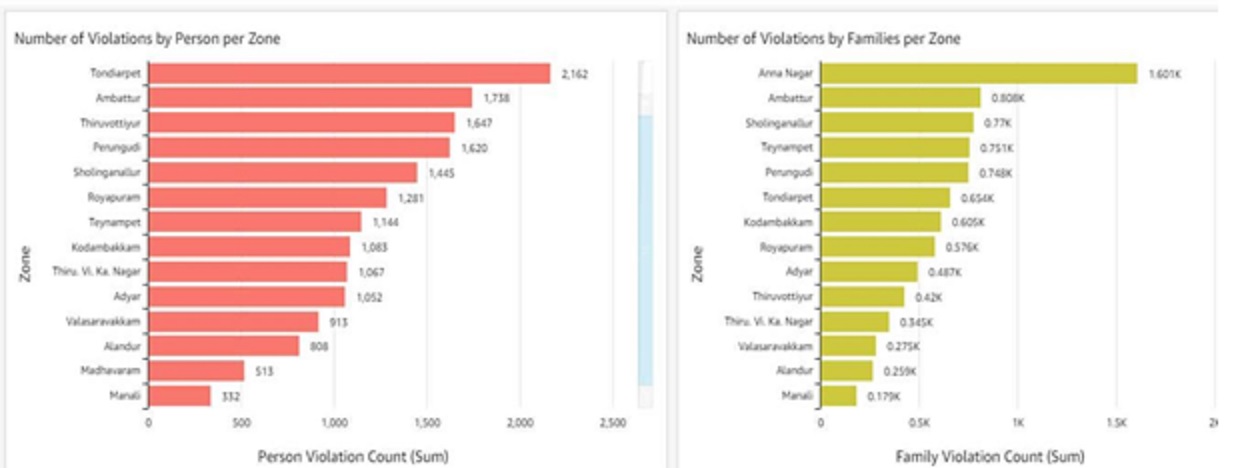
Violations by Zones
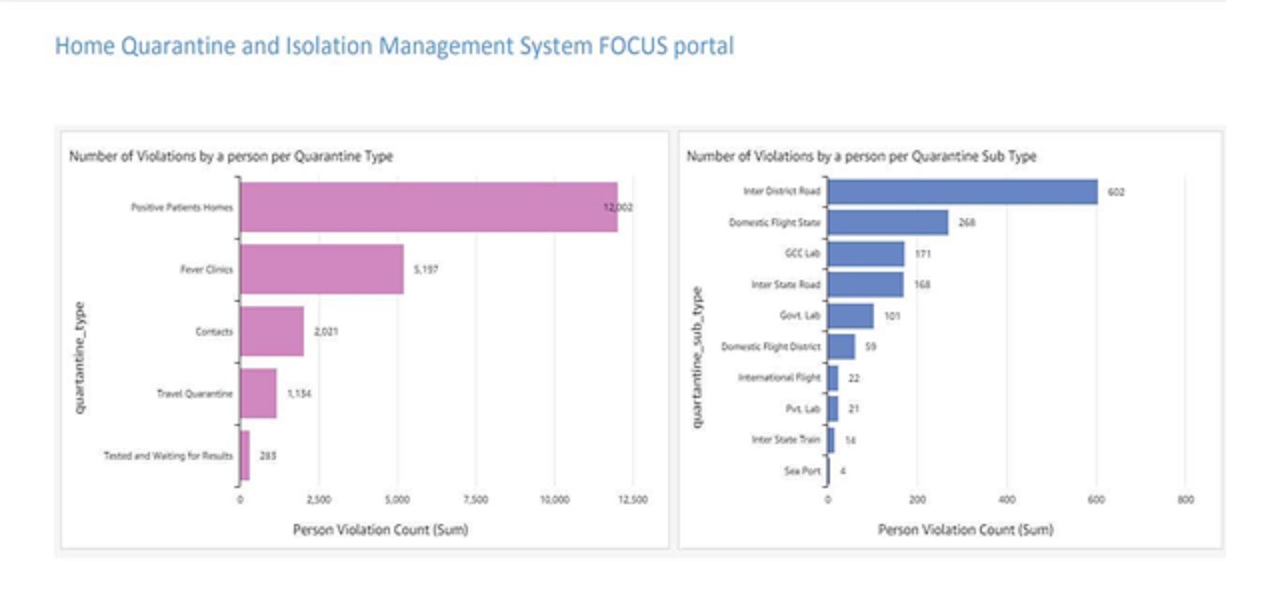
Violations by Quarantine Type
Impact
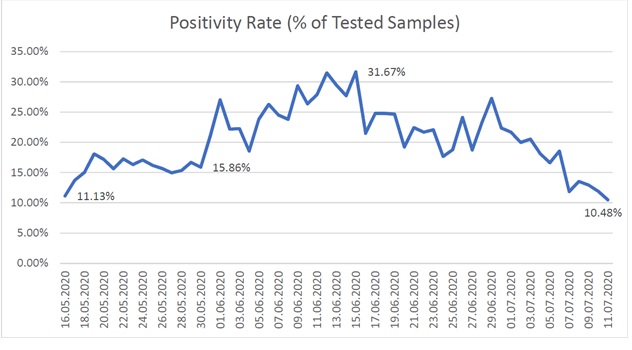
One metric which is used to measure the spread of COVID-19 infection is the positivity rate (% of positive patients among total samples tested). This positivity rate in the city was on an increasing trend and reached a high of around 31% in mid-June. It is at this time the HQIMS was rolled out by the city. This effort coupled with increased testing and an effective lockdown ensured the positivity rate dropped from a high of 31% to 10.4%.
Chennai’s response to COVID is an example of how data, bolstered with technology, can help combat unprecedented governance challenges in an efficient and effective manner.