 GOVERNMENT
OF INDIA
GOVERNMENT
OF INDIA
A Digital India Initiative
GOVERNMENT
OF INDIA


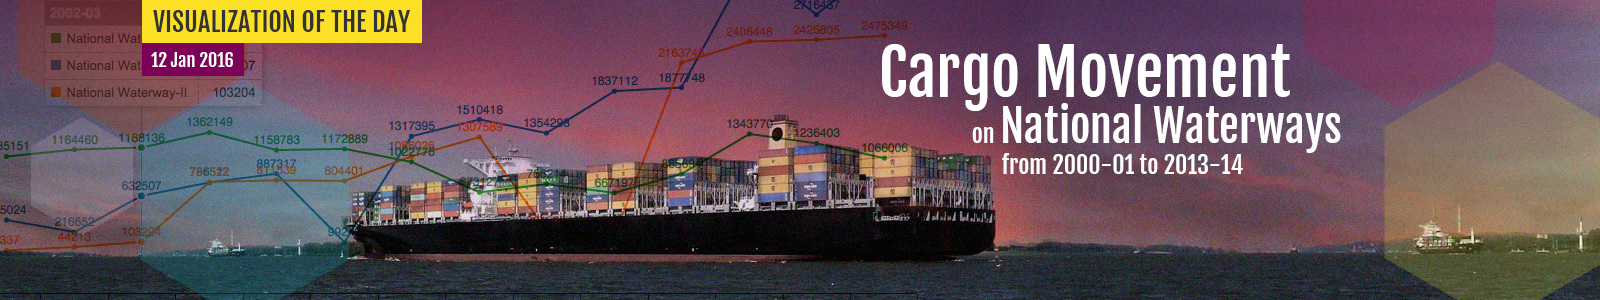
National Waterway-I consists of the Ganga – Bhagirathi – Hooghly river system between Haldia and Allahabad connecting Haldia-Kolkata – Farakka – Munger – Patna – Varanasi – Allahabad, stretching to about 1620 Kilometers. National Waterway-II consists of the river Brahmaputra between Bangladesh Border and Sadiya connecting Dhubri-Pandu (Guwahati)-Tezpur-Neamati- Dibrugarh-Sadiya, stretching to about 891 Kilometers. National Waterway-III consists of West Coast Canal located in Kerala from Kollam to Kottapuram, stretching to about 205 Kilometers – West coast canal (Kottapuram – Kollam) 168 km; Udyogmandal canal (Kochi Pathalam bridge) 23 km; and Champakara canal (Kochi – Ambalamugal) 14 km.
The cargo movement on the National Waterway-I in 2000-01 was 355024 tonnes. The cargo movement on the National Waterway-I in 2001-02 was 216652 tonnes. It recorded -38.98% decline over the previous year. The cargo movement on the National Waterway-I in 2013-14 was 3349138 tonnes. It recorded 23.29% growth over the previous year. The total growth recorded during 2000-01 to 2013-14 was 843.36%.
The cargo movement on National Waterway-II in 2000-01 was 5337 tonnes. The cargo movement on National Waterway-II in 2001-02 was 44213 tonnes. It recorded 728.42% growth over the previous year. The cargo movement on National Waterway-II in 2013-14 was 2475349 tonnes. It recorded 2% growth over the previous year. The total growth recorded during 2000-01 to 2013-14 was 46280.91%. National Waterway-II had shown phenomenal growth in cargo movement during the period.
The cargo movement on National Waterway-III in 2000-01 was 1085151 tonnes. The cargo movement on National Waterway-III in 2001-02 was 1164460 tonnes. It recorded 7.31% growth over the previous year. The cargo movement on National Waterway-III in 2013-14 was 1066006 tonnes. It recorded -13.78% decline over the previous year. The total decline recorded during 2000-01 to 2013-14 was -1.76%.