 GOVERNMENT
OF INDIA
GOVERNMENT
OF INDIA
A Digital India Initiative
GOVERNMENT
OF INDIA


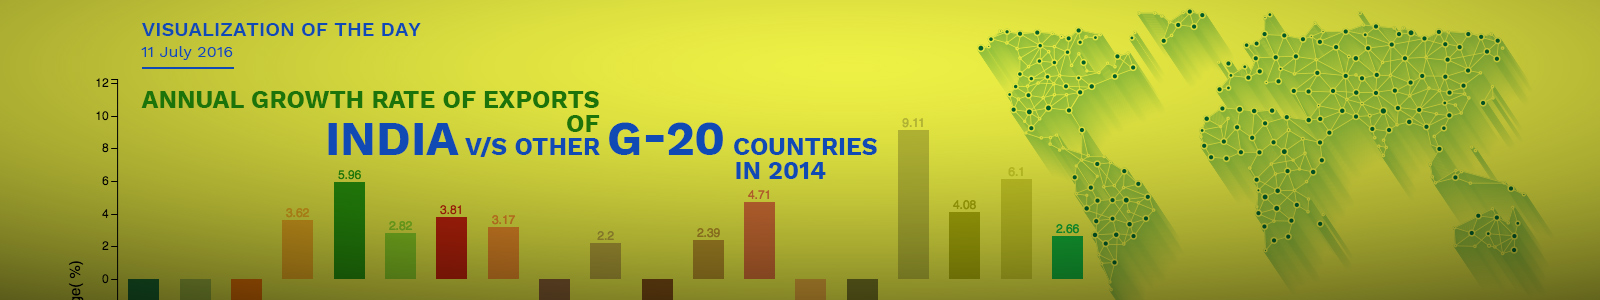
The annual growth rate of exports of the world (incl. re-exports) was 2.91 in 2013-14. It was 0.8% higher than the annual growth rate of exports i.e. 2.11% in 2012-13. The top 10 G-20 countries in terms of the annual growth rate of exports were: South Africa, United Kingdom, China, Mexico, Turkey, Germany, Canada, India, France and United States in 2013-14.
The annual growth rate of exports of South Africa was 9.11 in 2013-14. It was 13.69% higher than the annual growth rate of exports i.e. -4.58% in 2012-13. The annual growth rate of exports of United Kingdom was 6.1 in 2013-14. It was 5.62% higher than the annual growth rate of exports i.e. 0.48% in 2012-13. The annual growth rate of exports of China was 5.96 in 2013-14. It was -1.91% lower than the annual growth rate of exports i.e. 7.87% in 2012-13. The annual growth rate of exports of Mexico was 4.71 in 2013-14. It was 2.23% higher than the annual growth rate of exports i.e. 2.48% in 2012-13. The annual growth rate of exports of Turkey was 4.08 in 2013-14. It was 4.54% higher than the annual growth rate of exports i.e. -0.46% in 2012-13.
The annual growth rate of exports of Germany was 3.81 in 2013-14. It was 0.67% higher than the annual growth rate of exports i.e. 3.14% in 2012-13. The annual growth rate of exports of Canada was 3.62 in 2013-14. It was 2.83% higher than the annual growth rate of exports i.e. 0.79% in 2012-13. The annual growth rate of exports of India was 3.17 in 2013-14. It was -1.98% lower than the annual growth rate of exports i.e. 5.15% in 2012-13. The annual growth rate of exports of France was 2.82 in 2013-14. It was 1.15% higher than the annual growth rate of exports i.e. 1.67% in 2012-13. The annual growth rate of exports of United States was 2.66 in 2013-14. It was 0.51% higher than the annual growth rate of exports i.e. 2.15% in 2012-13.
Among the various countries of the world, the inter-country range of annual growth rate of exports was 22.36% in the year 2014. The maximum annual growth rate of exports i.e. 9.11% was in South Africa. The minimum annual growth rate of exports, in fact negative growth, i.e. -13.25% was in Argentina.
Note: Figures of exports given above are of export from respective countries to the world; NA: Not Available; Original Source: International Trade Statistics 2015; World Trade Organization (2002-2014- data); International Financial Statistics; IMF (2010-2014-data); European Commission Dte. General for Trade (For EU Exports Data) and European Central Bank (for Euro -Dollar Conversion); and also published in statistical year book 2016 by MOSPI.