 GOVERNMENT
OF INDIA
GOVERNMENT
OF INDIA
A Digital India Initiative
GOVERNMENT
OF INDIA


Case Study on Particulate matters (PM2.5 and PM10)
Particulate matter (particle pollution or PM) indicates extremely small solid particles and liquid droplets suspended in air. This pollution mainly comes from motor vehicles, industries, stubble burning etc. During dust storms, particle pollution can reach extremely high concentrations. The size of particles affects their potential to cause health problems.
Pollution particles with a diameter of 2.5 microns or less are termed as PM2.5. These particles are so small they can get deep into the lungs and into the bloodstream. It is evident that exposure to PM2.5 over prolong period may cause adverse health effects. PM10 (particles with a diameter of 10 microns or less) particles are small enough to pass through the throat and nose and enter the lungs. Once inhaled, these particles can affect the heart and lungs and cause serious health effects.
There are many health effects from exposure to particulate matters. Several studies have showed associations between exposure to PM particles and increased hospital admissions as well as death from heart or lung diseases. Short-term exposure, described in hours to days, can lead to irritation in eyes nose and throat, worsening asthma and lung diseases such as chronic bronchitis, premature death due to diseases of the respiratory and cardiovascular systems. Long-term exposure or exposure for several years, can lead to reduced lung function, development of cardiovascular and respiratory diseases, increased rate of disease progression, reduction in life expectancy etc.
For this case study, month-wise data of Particulate Matter’s concentration (PM 2.5 and PM 10) at 5 different locations of Chandigarh have been considered for the year of 2019 and 2020. The months-wise average PM 2.5 and PM 10 concentrations data of these 5 locations of Chandigarh has been assumed as the month-wise PM 2.5 and PM 10 concentrations in Chandigarh. Further, the data for the year 2019 has been compared to the data of year 2020 to analyze rise/ fall in the PM levels in particular month of corresponding year.
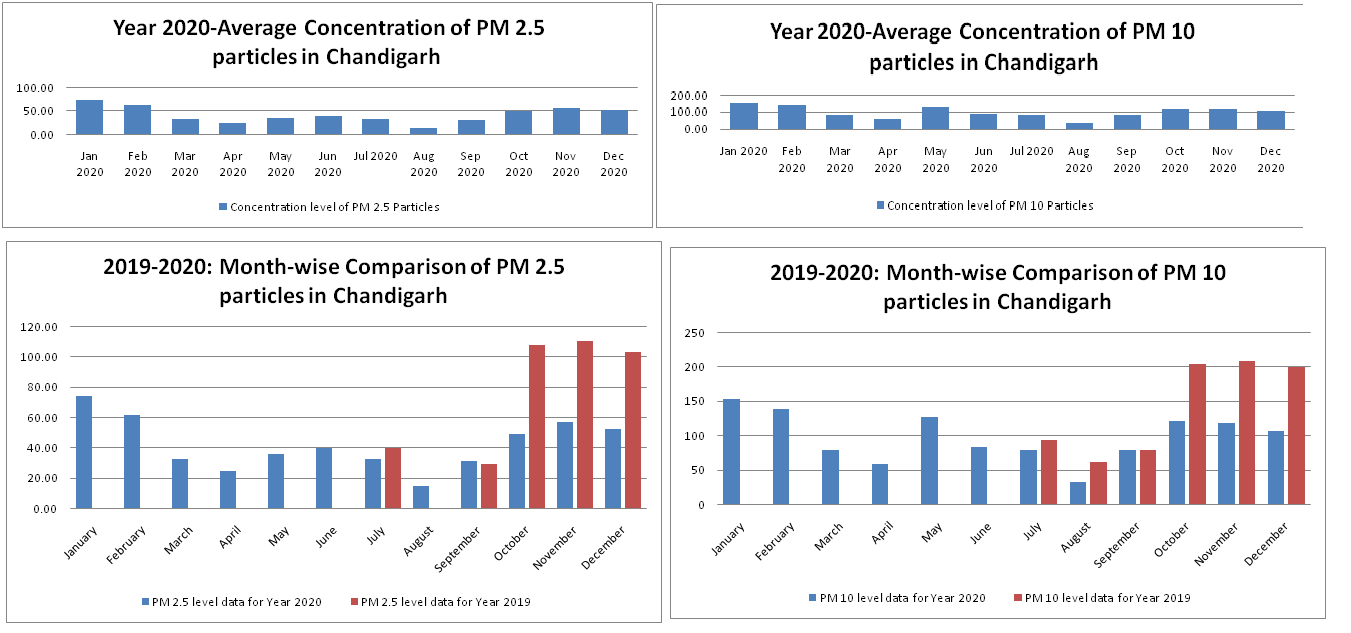
Following points may be concluded after analysis of data mentioned in above charts:
Based on the above analysis, following measures may be adopted to reduce the levels of particulate matter pollution: