 GOVERNMENT
OF INDIA
GOVERNMENT
OF INDIA
A Digital India Initiative
Please login using your email address as it is mandatory to access all the services of community.data.gov.in
GOVERNMENT
OF INDIA


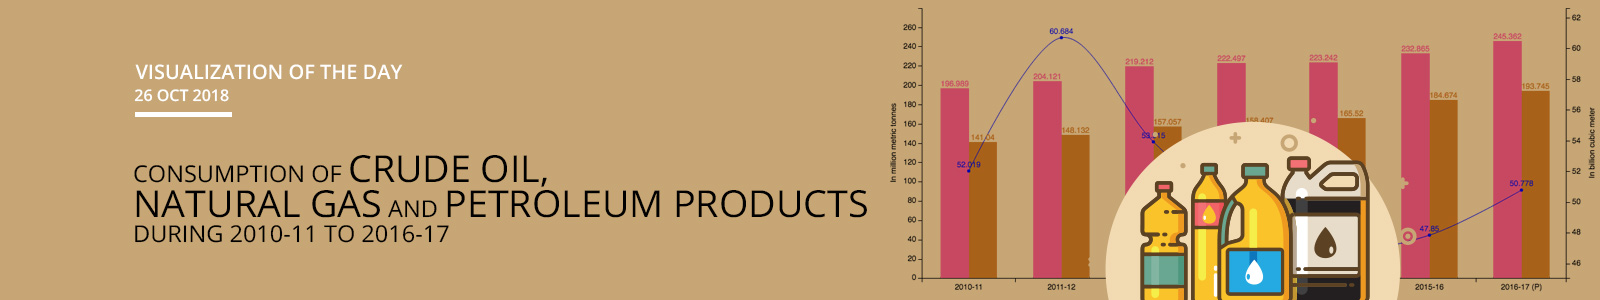
We have observed compound annual growth rate of 3.73% in Consumption of Crude Oil during 2010-11 to 2016-17. Consumption of Crude Oil was 196.989 Million Metric Tonnes (MMT) during 2010-11. It has increased by 3.62% to 204.121 MMT during 2011-12 over 2010-11. An annual growth of 5.37% has been seen in Consumption of Crude Oil to 245.362 MMT during 2016-17 versus 232.865 MMT during 2015-16. Maximum annual growth rate of 7.39% has been found in Consumption of Crude Oil in 2012-13 during the period under consideration.
Compound annual growth rate of -0.4% has been seen in Consumption of Natural Gas during 2010-11 to 2016-17. Consumption of Natural Gas was 52.019 Billion Cubic Meter (BCM) during 2010-11. It has increased by 16.66% to 60.684 BCM during 2011-12 over 2010-11. We have observed annual growth of 6.12% in Consumption of Natural Gas from 47.85 BCM during 2015-16 to 50.778 BCM during 2016-17. Maximum annual growth rate of 16.66% has been seen in Consumption of Natural Gas in 2011-12 during the period under consideration.
We have seen compound annual growth rate of 5.43% in Consumption of Petroleum Products during 2010-11 to 2016-17. Consumption of Petroleum Products was 141.04 MMT during 2010-11. It has increased by 5.03% to 148.132 MMT during 2011-12 over 2010-11. An annual growth of 4.91% has been observed in Consumption of Petroleum Products to 193.745 MMT during 2016-17 versus 184.674 MMT during 2015-16. Maximum annual growth rate of 11.57% has been found in Consumption of Petroleum Products in 2015-16 during the period under consideration.
Note: NA: Not Available; Oil Development Cess figures have been taken from Table VII.2 which are on accrual basis.
Dataset URL: https://data.gov.in/catalog/indian-petroleum-and-natural-gas-statistics-2016-17
Resource Title: Trends in Indian Petroleum Industry at a Glance from 2010-11 to 2016-17