 GOVERNMENT
OF INDIA
GOVERNMENT
OF INDIA
A Digital India Initiative
Please login using your email address as it is mandatory to access all the services of community.data.gov.in
GOVERNMENT
OF INDIA


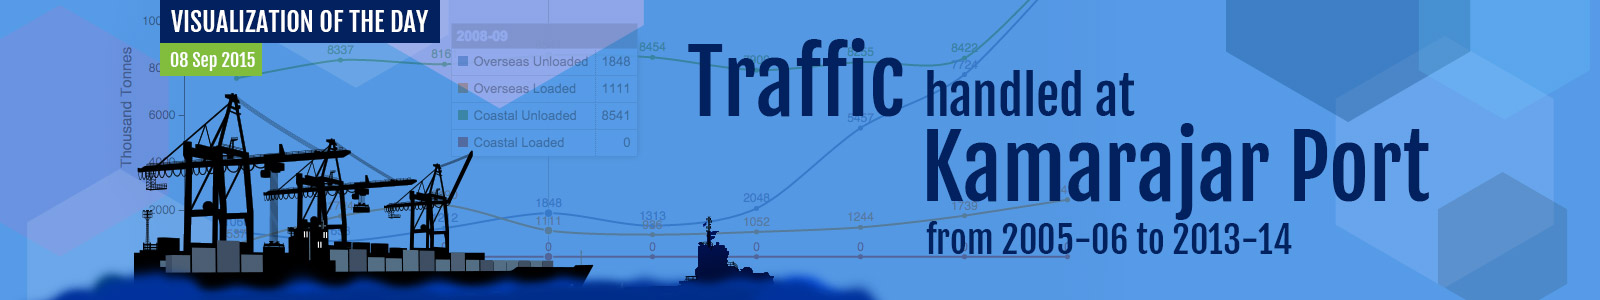 This visualization shows the traffic handled at Kamarajpar Port from 2005-06 to 2013-14.
In year 2005-06, total traffic handled was 9168 Thousand Tonnes that was increased by 169.6% from 2001-02. Traffic handled in Overseas Unloaded and Overseas Loaded categories were 1066 Thousand Tonnes and 537 Thousand Tonnes respectively in 2005-06. In Coastal Unloaded category, traffic handled was 7565 Thousand Tonnes in 2005-06 that was increased by 122.4% from 2001-02. Traffic handled in Coastal Loaded category was 0 in year 2005-06.
Total Traffic handled in 2009-10 was 10703 Thousand Tonnes that was increased by 16.7% from 2005-06. Traffic handled in Overseas Unloaded category was 1313 Thousand Tonnes in 2009-10 that was increased by 23.2% from year 2005-06. Traffic handled in Overseas Loaded category was 936 Thousand Tonnes that was increased by 74.3% from year 2005-06 and traffic handled in Coastal Unloaded category was 8454 Thousand Tonnes that showed growth of 11.8% from year 2005-06. Traffic handled in Coastal Loaded Category was 0 Thousand Tonnes in year 2009-10.
In Year 2013-14, total traffic handled was 27337 Thousand Tonnes that showed growth of 155.4% from 2009-10. Traffic handled in Overseas Unloaded category was 12310 Thousand Tonnes that was increased by 837.5% from 2009-10. Traffic handled in Overseas Loaded category was 2415 Thousand Tonnes that was increased by 158% to 2009-10. Traffic handled in Coastal Unloaded category was 12612 Thousand Tonnes that showed growth of 49.2% from 2009-10. Traffic handled in Coastal Loaded category was 0 Thousand Tonnes in year 2013-14.
Total traffic handled at port in 2013-14 showed growth of 198.2% from year 2005-06.