 GOVERNMENT
OF INDIA
GOVERNMENT
OF INDIA
A Digital India Initiative
Please login using your email address as it is mandatory to access all the services of community.data.gov.in
GOVERNMENT
OF INDIA


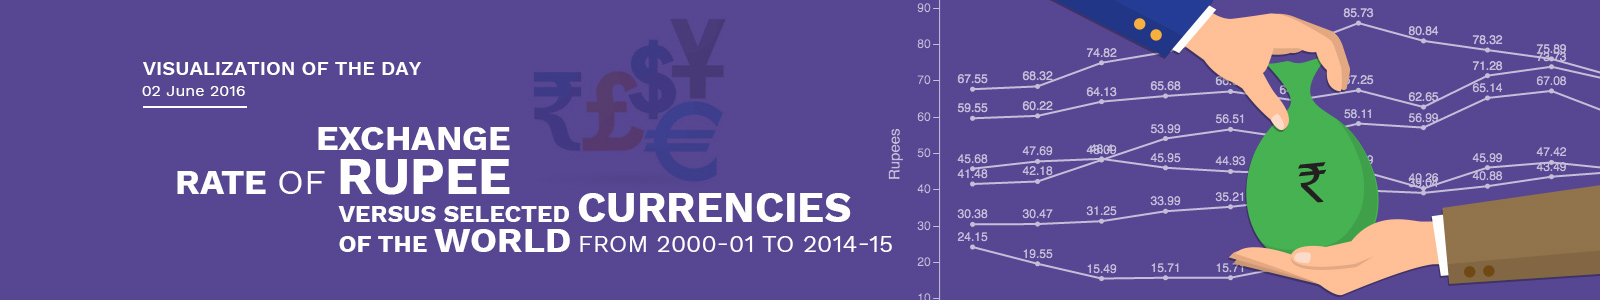
The exchange rate of US Dollar was Rs. 45.68 in 2000-01. It increased to Rs. 61.14 in 2014-15, recording an appreciation of Rs.15.46 (33.84%) as compared to 2000-01. The average annual percentage appreciation was 2.42% during the period from 2000-01 to 2014-15.The exchange rate of Pound Sterling was Rs. 67.55 in 2000-01. It increased to Rs. 98.57 in 2014-15, recording an appreciation of Rs.31.02 (45.92%) as compared to 2000-01. The average annual percentage appreciation was 3.28% during the period from 2000-01 to 2014-15.
The exchange rate of Euro was Rs. 41.48 in 2000-01. It increased to Rs. 77.52 in 2014-15, recording an appreciation of Rs.36.04 (86.89%) as compared to 2000-01. The average annual percentage appreciation was 6.21% during the period from 2000-01 to 2014-15. Euro recorded maximum absolute appreciation of Rs.36.04 during the period from 2000-01 to 2014-15 amongst the analyzed currencies.
The exchange rate of Yen was Rs. 0.41 in 2000-01. It increased to Rs. 0.56 in 2014-15, recording an appreciation of Rs.0.15 (36.59%) as compared to 2000-01. The average annual percentage appreciation was 2.61% during the period from 2000-01 to 2014-15. Yen recorded minimum absolute appreciation of Rs. 0.15 during the period from 2000-01 to 2014-15 amongst the analyzed currencies.
The exchange rate of Canadian Dollar was Rs. 30.38 in 2000-01. It increased to Rs. 53.78 in 2014-15, recording an appreciation of Rs.23.4 (77.02%) as compared to 2000-01. The average annual percentage appreciation was 5.5% during the period from 2000-01 to 2014-15. The exchange rate of Brazilian Real was Rs. 24.15 in 2000-01. It increased to Rs. 24.84 in 2014-15, recording an appreciation of Rs.0.69 (2.86%) as compared to 2000-01. The average annual percentage appreciation was 0.2% during the period from 2000-01 to 2014-15.
The exchange rate of Special Drawing Rights (SDR) of International Monetary Fund (IMF) was Rs. 59.55 in 2000-01. It increased to Rs. 90.8 in 2014-15, recording an appreciation of Rs.31.25 (52.48%) as compared to 2000-01. The average annual percentage appreciation was 3.75% during the period from 2000-01 to 2014-15.
Note: Data refers to Financial Year-Annual Average for respective years; SDRs: Special Drawing Rights; RTP: Reserve Tranche Position in IMF; Gold has been valued close to international market price; Conversion of foreign currency assets and SDR in US dollars is done at exchange rates supplied by the IMF; Transactions with IMF are converted at respective SDR/$ rate; While reserves pertain to end period, repurchases are for the relevant periods; FCA excludes US$ 250.00 million invested in foreign currency denominated bonds issued by IIFC (UK) since March 20, 2009, excludes US$ 380.00 million since September 27, 2011, US$ 550.000 million since February 27, 2012, US$ 673.00 million since March 30, 2012, US$ 790 million since July 5, 2012 and US$ 950 million since March 8, 2013; Foreign Currency Assets; Gold includes Rupee 31463 crore (US$ 6699 million) reflecting the purchase of 200 metric tonnes of Gold from IMF on November3, 2009; SDRs includes SDRs 3082.5 million allocated under general allocation and SDRs 214.6 million allocated under special allocation by the IMF done on August 28, 2009 and September 2009 respectively; Original Source: Reserve Bank of India and also published in statistical year book 2016 by MOSPI.