 GOVERNMENT
OF INDIA
GOVERNMENT
OF INDIA
A Digital India Initiative
Please login using your email address as it is mandatory to access all the services of community.data.gov.in
GOVERNMENT
OF INDIA


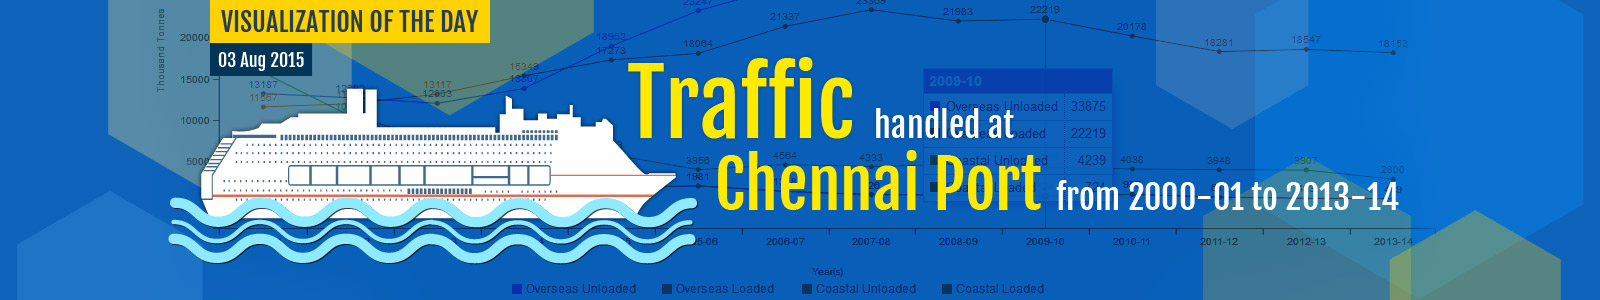
The total traffic handled at Chennai port in 2000-01 was 41220 Thousand Tonnes and it increased to 51105 Thousand Tonnes in 2013-14. The traffic handled at Chennai port in the Overseas Unloaded category in 2000-01 was 13187 Thousand Tonnes. The traffic handled in Overseas Loaded category in 2000-01 was 11567 Thousand Tonnes. The traffic handled in Coastal Unloaded category in 2000-01 was 15733 Thousand Tonnes. The traffic handled in Coastal Loaded category in 2000-01 was 733 Thousand Tonnes.
The traffic handled at Chennai port in the Overseas Unloaded category in 2001-02 was 12682 Thousand Tonnes. It recorded -3.83% decline over the previous year. The traffic handled in Overseas Loaded category in 2001-02 was 11952 Thousand Tonnes. It recorded 3.33% growth over the previous year. The traffic handled in Coastal Unloaded category in 2001-02 was 10458 Thousand Tonnes. It recorded -33.53% decline over the previous year. The traffic handled in Coastal Loaded category in 2001-02 was 1023 Thousand Tonnes. It recorded 39.56% growth over the previous year.
The traffic handled at Chennai port in the Overseas Unloaded category in 2013-14 was 29733 Thousand Tonnes. It recorded -2.41% decline over the previous year. The total growth recorded during 2000-01 to 2013-14 was 125.47%. The traffic handled in Overseas Loaded category in 2013-14 was 18153 Thousand Tonnes. It recorded -2.12% decline over the previous year. The total growth recorded during 2000-01 to 2013-14 was 56.94%. The traffic handled in Coastal Unloaded category in 2013-14 was 2800 Thousand Tonnes. It recorded -28.33% decline over the previous year. The total decline recorded during 2000-01 to 2013-14 was -82.2%.
The traffic handled in Coastal Loaded category in 2013-14 was 419 Thousand Tonnes. It recorded -13.25% decline over the previous year. The total decline recorded during 2000-01 to 2013-14 was -42.84%.
Note: Figures in (000 Tonnes), Source: Chennai Port 1950-51, breakup of Loaded and Unloaded Cargo not available.