 GOVERNMENT
OF INDIA
GOVERNMENT
OF INDIA
A Digital India Initiative
Please login using your email address as it is mandatory to access all the services of community.data.gov.in
GOVERNMENT
OF INDIA


Background:
COVID-19 has been a challenge for all administrations over the past 2 years. Satna was also finding it difficult to understand the scope of the disease spread so as to be able to take appropriate mitigation measures.
Solution:
A COVID-19 live monitoring dashboard has been developed by Satna Smart City for the purpose of monitoring, visualization, evaluation, and decision-making for the officers responsible as well as citizens for information dissemination. Through this application, monitoring of live COVID data is done which helps in analysis of availability of Hospital Beds, Vaccination Center, Hospital distance, Live heat map with Covid positive patients, and Existing per day ward wise Covid cases, etc. Other information being shown includes contact numbers of hospitals of Satna City’s and the entire district area in Satna, information regarding total beds, available beds, ICU beds, and oxygen supported beds, etc.
In addition, vaccination center’s with destination distance is shown via Google Map and address is given of Satna as well as Madhya Pradesh.
The most important part is that through this dashboard live positive patient’s ward-wise heat map visualization is being done in the three categories. In this, there are yellow, green, and red, in which the ward which has positive cases from 1 to 4 is kept in the yellow zone and the ward which has 0 (zero) positive cases are kept in the green zone and there are more than 5 cases in the ward, it is put in the red zone. The data presented in the heat map, is collated by a field worker and his staff. It is then converted into a single dashboard, as well as covers the total municipal area across 45 wards in Satna.
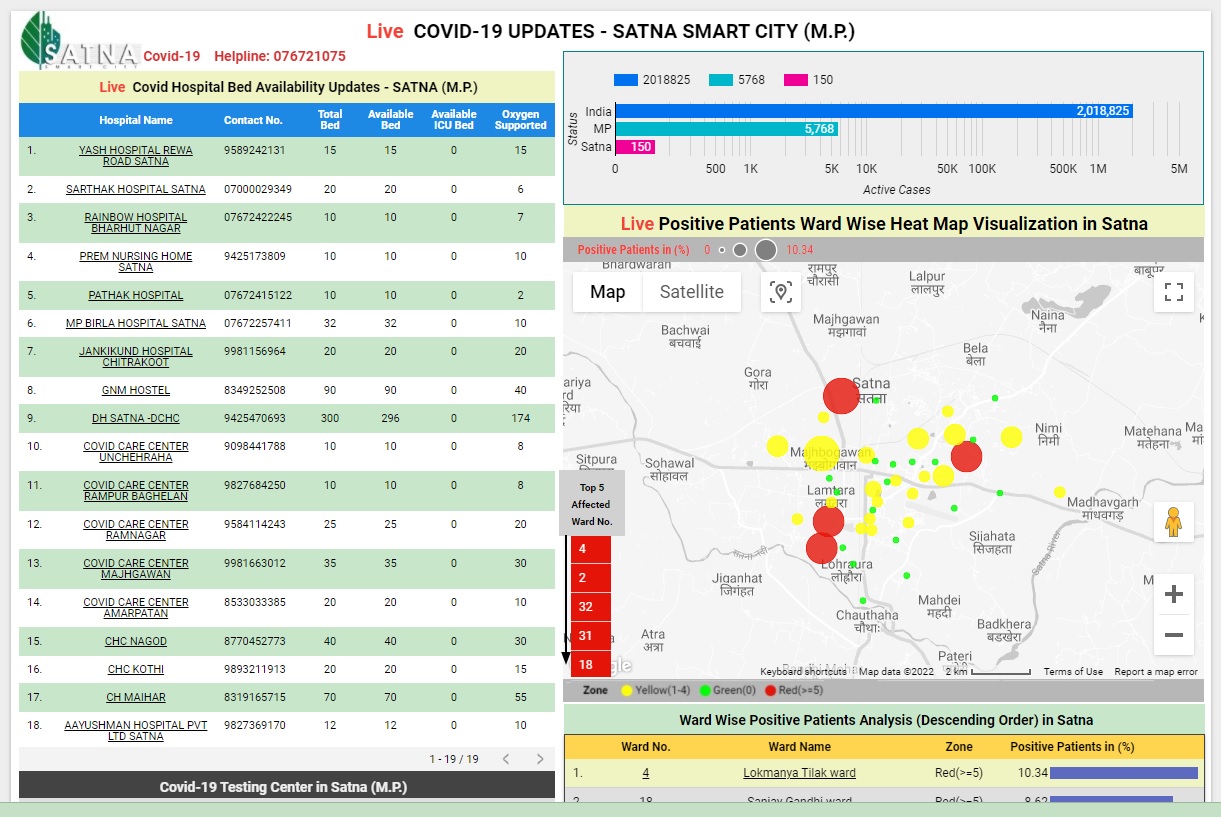
Also, day-by-day ward-wise positive cases are showcased through line graphs, using which we can find out how the Covid cases in each ward are increasing or decreasing. The dashboard also automatically calculates (via the heat map), the top five wards affected by Covid.
Outcome:
The data represented in the Dashboard is helping the Satna city officials take important decisions on how to tackle this pandemic. For example, the list of top 5 affected wards is used by the Municipal Corporation to prioritize the sanitization work in the morning and evening. In this way, data digitization and live monitoring of cases is helping all officers and employees to keep the citizens safe.