 GOVERNMENT
OF INDIA
GOVERNMENT
OF INDIA
A Digital India Initiative
Please login using your email address as it is mandatory to access all the services of community.data.gov.in
GOVERNMENT
OF INDIA


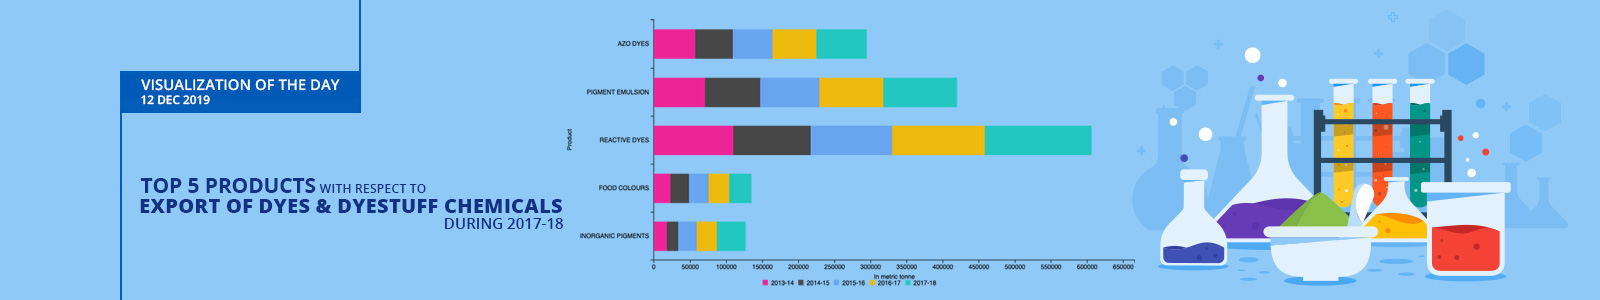
The top 5 products with respect to Export of Dyes & Dyestuff Chemicals during 2017-18 were Reactive Dyes, Pigment Emulsion, Azo Dyes, Inorganic Pigments and Food Colours. Export of Reactive Dyes was 147417 metric tonne during 2017-18, up by 14.8% versus 128417 metric tonne during 2016-17. In value term it was Rs. 379350 lakh and Rs. 413080 lakh during 2016-17 and 2017-18 respectively. We have seen annual growth of 13.42% in export of Reactive Dyes during 2016-17 from 113224 metric tonne during 2015-16. Its value was Rs. 344963 lakh during 2015-16.
Export of Pigment Emulsion was 81536 metric tonne during 2015-16. It has increased by 9.13% during 2016-17 over 2015-16. In value term it was Rs. 374190 lakh during 2015-16. Annual growth of 14.69% has been observed in export of Pigment Emulsion to 102051 metric tonne during 2017-18 against 88980 metric tonne during 2016-17. Its value was Rs. 392700 lakh and Rs. 441253 lakh during 2016-17 and 2017-18 respectively. Export of Azo Dyes was 69996 metric tonne during 2017-18, up by 15.91% against 60390 during 2016-17. Its value was Rs. 162456 lakh during 2016-17 and Rs. 181785 lakh during 2017-18. We have found annual growth of 9.15% in export of Azo Dyes during 2016-17 from 55327 metric tonne during 2015-16. In value term it was Rs. 161970 lakh during 2015-16.
We have seen annual growth of 48.13% in export of Inorganic Pigments from 27236 metric tonne during 2016-17 to 40345 metric tonne during 2017-18. Export of Inorganic Pigments was 25826 metric tonne during 2015-16. It has increased by 5.46% during 2016-17 over 2015-16. In value term it was Rs. 25522 lakh, Rs. 30609 lakh and Rs. 39484 lakh during 2015-16, 2016-17 and 2017-18 respectively. Export of Food Colours was 31110 metric tonne during 2017-18, up by 9.7% versus 28359 metric tonne during 2016-17. In value term it was Rs. 79492 lakh and Rs. 87129 lakh during 2016-17 and 2017-18 respectively. Annual growth of 4.64% has been observed in export of Food Colours during 2016-17 from 27101 metric tonne during 2015-16. Its value was Rs. 79537 lakh during 2015-16.
Note: Figures of QTY are in Metric Tonne; Figures of VAL are in Rs. Lakh; Source: DGCI & S, Kolkata, Ministry of Commerce & Industry; Disclaimer: Department of Chemicals and Petrochemicals does not take responsibility for the accuracy of the information or any loss arising from the use of information. **Data to be released on half yearly basis. Annual data for the previous years and for the period from April to September for the current year will be released in the last fortnight of January and annual data up to the last financial year will be released in the last fortnight of July. Revision in the data base, if required, will be done in the first week of April and October; Exports of Pesticides include both technical and formulations.
Dataset URL: https://data.gov.in/resources/export-major-chemicals-product-wise-group-wise-2010-11-2018-19-upto-september-2018
Resource Title: Export of Major Chemicals – Product wise / Group wise from 2010-11 to 2018-19 (upto September 2018)