 GOVERNMENT
OF INDIA
GOVERNMENT
OF INDIA
A Digital India Initiative
Please login using your email address as it is mandatory to access all the services of community.data.gov.in
GOVERNMENT
OF INDIA


Introduction
Sagar (formerly Saugor) is a city in the state of Madhya Pradesh in central India. Over the years the city has urbanized and that has led to increase in number of vehicles and enhanced vehicular emissions. We initiated a study the air quality levels in the last 2 years to understand whether the quality of air has deteriorated or improved. We decided to analyze the pollutant levels and monthly variation of pollutants over 18 months on the available data (that was collected and published in National Open Data Portal as sheet under D04 Environment).
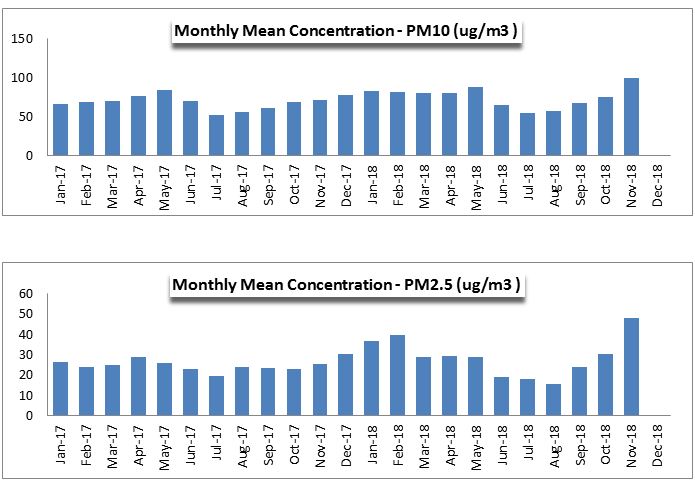
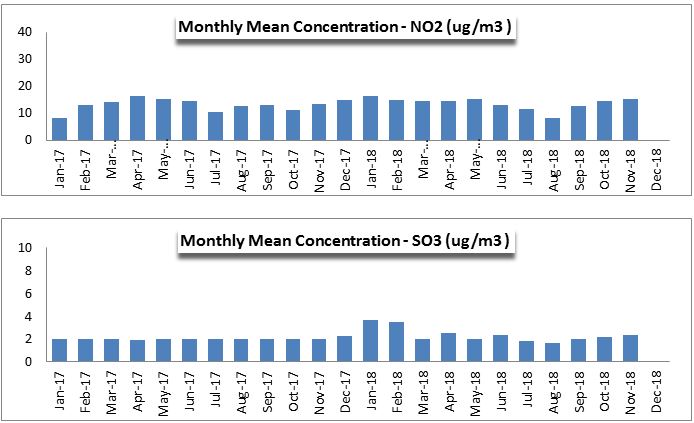
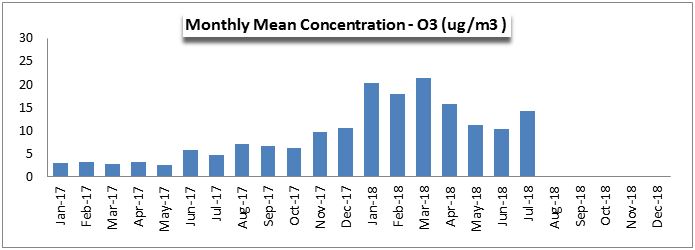
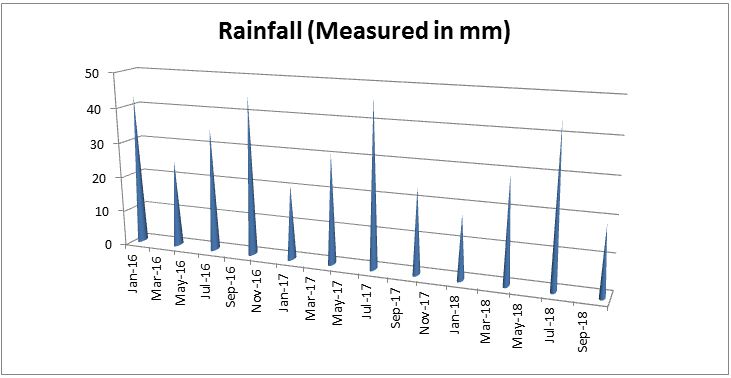
Sagar city has one ambient Air Quality monitoring at 532 – Deendayal Housing Board Colony in residential area. We used the data from that station as a monitoring tool for entire Sagar city representative. This data from Jan 2017 to Nov 2018 was collected and submitted for particulate levels and NO2, SO2 and O3 levels. In addition we took rainfall data from India Metrology Department for last 2 years to complete the study. The data was plotted in excel and trends were studies for (a) Small and large suspended particulates (b) SO2 emission (c) NO2 emissions (d) O3 emissions. Of these small suspended particulates of PM2.5 are more a signature of vehicular emission and large particulates PM10 are due to mining and construction. We analyzed this data to develop insights of pollutant levels over time for Sagar city, Month-to-Month variation, Rainfall and Weather impact on the pollutant levels.
Key findings
Conclusion
Based on the analysis conducted, it was found that in November the particulate levels are quite high in city and steps need to be taken to curb this problem and improve livability for the people.