 GOVERNMENT
OF INDIA
GOVERNMENT
OF INDIA
A Digital India Initiative
Please login using your email address as it is mandatory to access all the services of community.data.gov.in
GOVERNMENT
OF INDIA


Aizawl is the capital of the state of Mizoram in India. With a population of 293,416, it is the largest city in the state. Aizawl has a mild, sub-tropical climate due to its location and elevation. Under the Köppen climate classification, Aizawl features a humid subtropical climate but very rainy. In the summer the temperature ranges from 20–30 °C (68–86 °F), and in the winter 11–21 °C (52–70 °F). The Aizawl Municipal Council is the authority of Civic Administration of Aizawl city. It was formed in 2010. The tenure of the council is five years. There is a Ward Committee in every ward that consists of a Chairman, who is an elected councillor from that ward, and two members each from all the local council within the ward. There are 78 local councils having a term of 5 years. As of 2011 India census, Aizawl had a population of 293,416. Females constitute 50.61% of the population and males made up the remaining 49.39%. Mizo’s from various tribes make up the majority of the population. Christianity forms majority of the city population about 93.63%.Other minority religions are Hinduism 4.14, Islam 1.52, Buddhism 0.45, Others 0.09%, Sikhism 0.03% and Jainism 0.02%. 0.11% peoples did not state their religion. The economy of Aizawl is basically sustained by government services as it is capital of Mizoram.
Environment in Aizawl:
Aizawl is located at the hill top with rich natural beauties; it has a free air conditioned climate throughout the year. The temperature is neither too hot nor cold; pollution of air is not high with clean air. As maintained by the State Pollution Control Board during the month of Jan 17- Dec 18
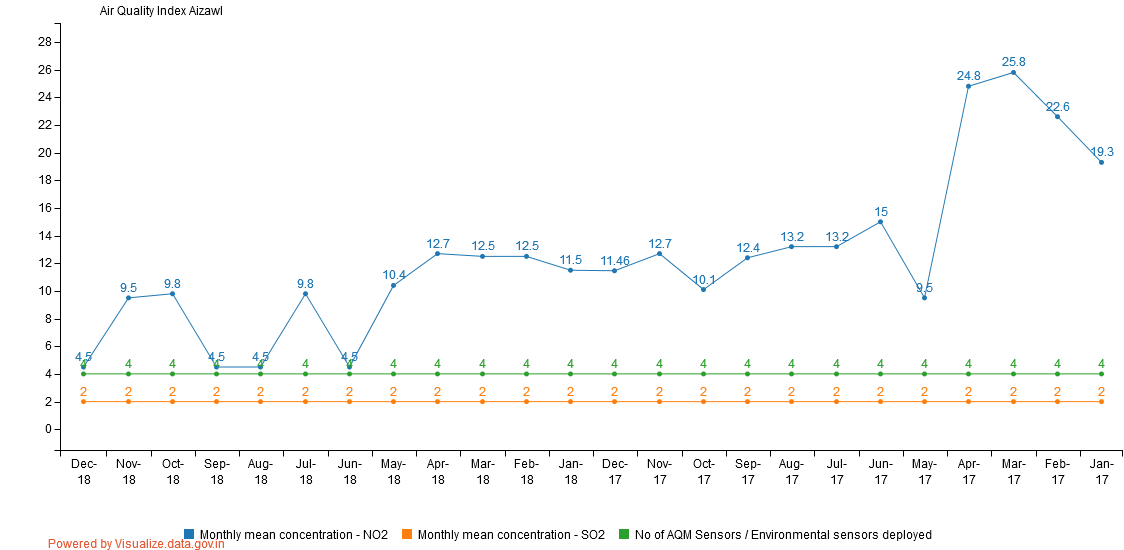
Key findings: As observe in the graph, it shows that the air quality index over the past year shows the following.
4.5. During the one year mark, the average in 12.36 which is minimal for air quality
Geographical Area for Aizawl City:
Aizawl City is divided into 19 Wards of Municipal Council Area, the total Area is 157.56 Sq kms, Residential area (in sq Km) is around 11.64 sq kms and Non-residential area ( in sq Km) is 146.93.
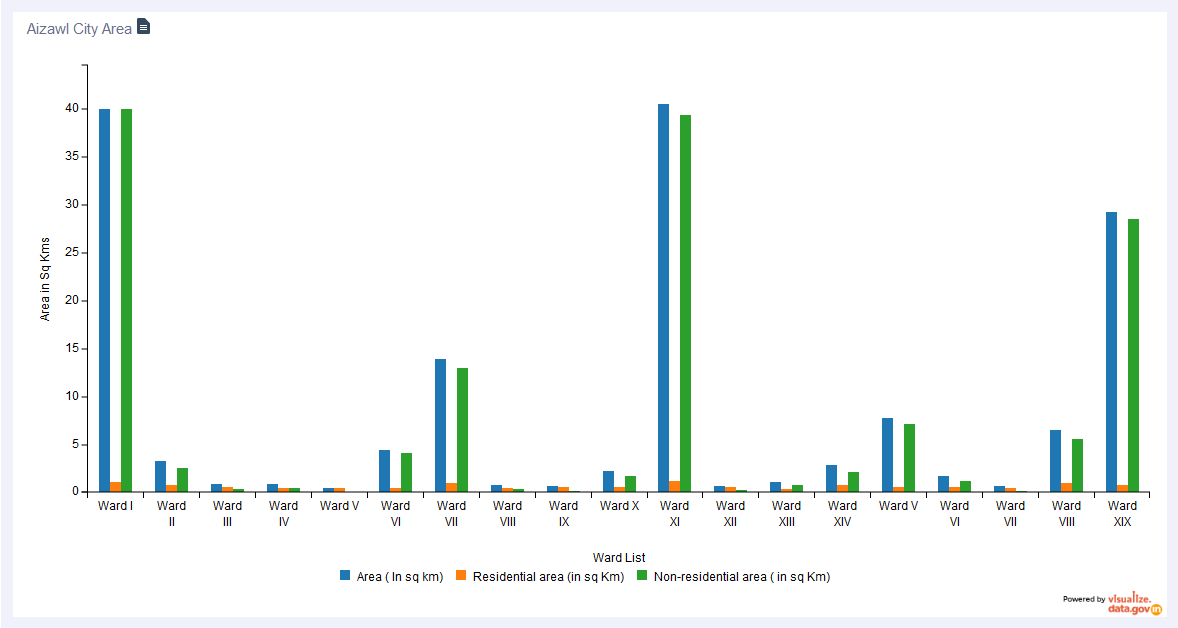
Key findings: The Graph highlights that almost 93% of the area is Non-residential area, just 7% covers residential area. Ward no XI is the largest area which is 40.437 Sq km, while Ward No V is only just covers 0.443 sq km
Ward I, XI, XIX areas has least area under residential with just 3% of the entire land is used for residential area whereas 89% of the area in Ward 5 is used for Residential area, it can be conclude that it is the densely populated area among the 19 wards of the entire City of Aizawl.
Aizawl City has potential and way forward for the future development, large amount of infrastructures can be obtained with the vacant land. It shows that the city is not densely populated and the environment is good for better living. The entire city can hold its population in terms of the land use.
Population of Aizawl City:
Based on the census report of Aizawl City, total nos of Households are 67,594; The city has huge gap of population and households among the 19 wards.
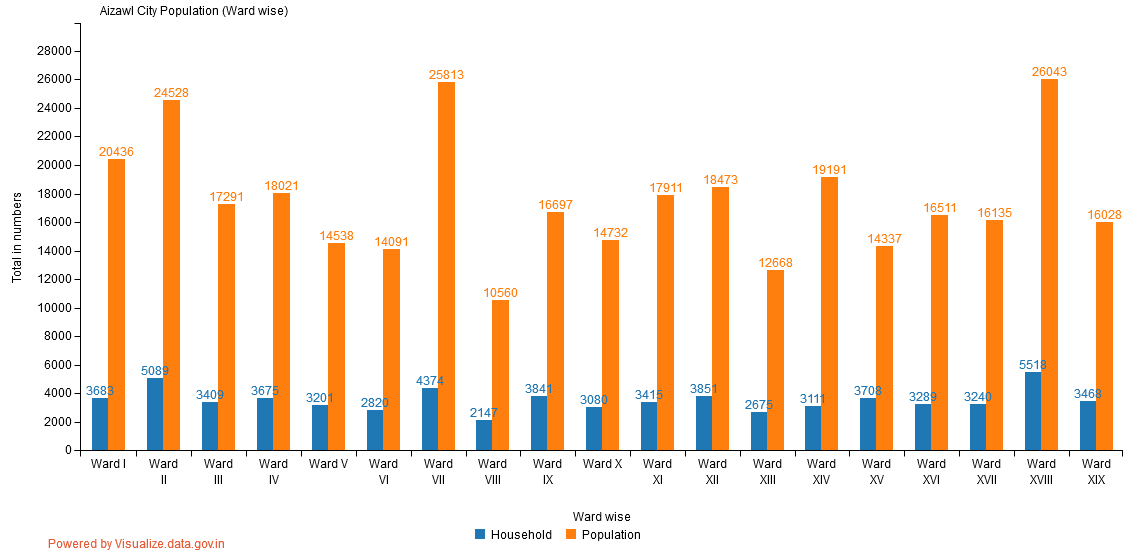
Key Findings: The Graph reveals that ward no XVII has largest population 26,043 and households 5,518 while ward no VIII has the least no of population comprises of 10,560 and 2147 households.
Crimes Record in Aizawl:
Aizawl City is one of the most peaceful city across the entire India. People are well behaved, crimes records are minimal.
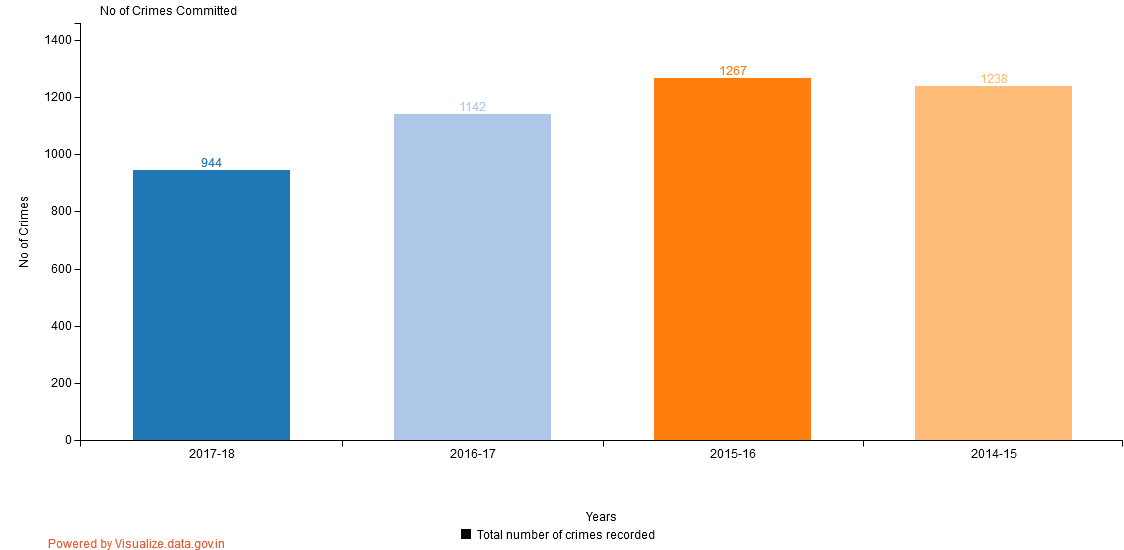
Key Findings: The Graph reveals that the crimes record is highest during the year 2015-16, it is recorded that 1267 record have been found out. The remarkable thing is that the crime rates decrease year by year on 2017-18 it shows that only 944 has been recorded.
Conclusion:
With the data records and visualising the data, the systematic analysis of the city can be obtained. More and More data can be analysed in the future as well.