 GOVERNMENT
OF INDIA
GOVERNMENT
OF INDIA
A Digital India Initiative
GOVERNMENT
OF INDIA


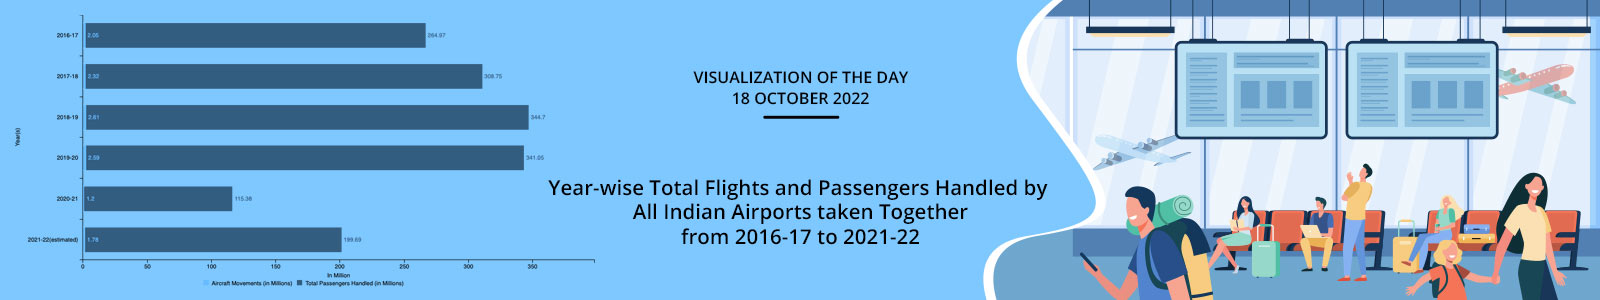
This Horizontal multi-bar chart provides information about the year-wise total flights and passengers handled by All Indian Airports from 2016-17 to 2021-22. A total of 12.55 million aircraft movements and 1574.54 million passengers were handled from 2016-17 to 2021-22. The highest of 344.7 million passengers were handled and 2.61 million aircraft movement in in 2018-19.
The lowest of 115.38 million passengers were handled and 1.2 million aircraft movement in 2020-21.
Note – Source – RAJYA SABHA SESSION – 256 UNSTARRED QUESTION No 2740. Data Figures are in Millions. Source – Airports Authority of India (AAI).
Dataset URL: https://data.gov.in/resource/year-wise-total-flights-and-passengers-handled-all-indian-airports-taken-together-2016-17
Resource Title: Year-wise Total Flights and Passengers Handled by All Indian Airports taken Together from 2016-17 to 2021-22