 GOVERNMENT
OF INDIA
GOVERNMENT
OF INDIA
A Digital India Initiative
GOVERNMENT
OF INDIA


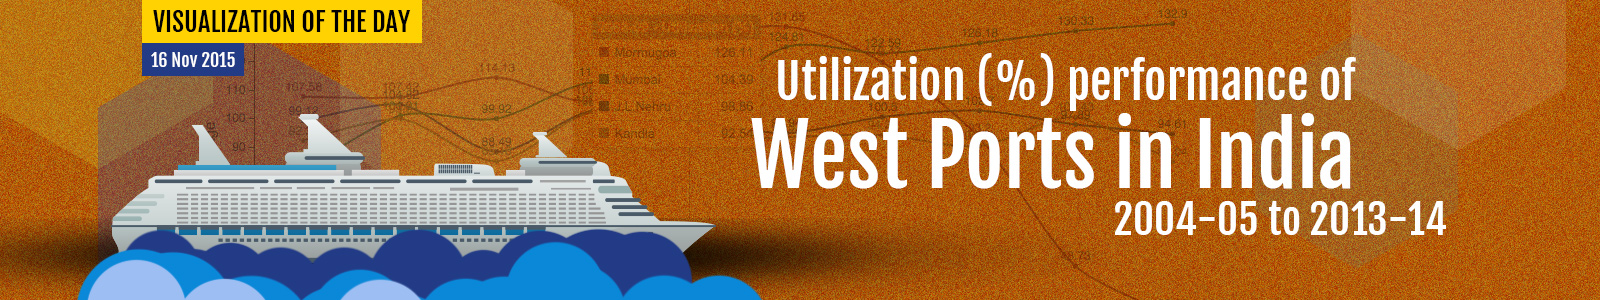
India has a coastline spanning of 7516.6 kilometres, forming one of the biggest peninsulas and sixteenth largest maritime country in the world. It is serviced by 13 major ports namely Kolkata, Haldia, Paradip, Visakhapatnam, Ennore, Chennai, Tuticorin, Cochin, N.Mangalore, Mormugoa, J.L.Nehru, Mumbai and Kandla.
In West side of India there are 4 Major ports namely Mormugoa, J.L.Nehru, Mumbai and Kandla. In Utilization (%) point of view at Mormugoa port, a gradual upward trend seen from 107.58% (2004-05) to 131.85% (2009-10) bottoming in the year 2007-08 (106.29%) and a drastic downward trend seen from 131.85% (2009-10) to 32.03% (2013-14). In 2004-05, Mormugoa port had reported traffic of 30.66 million tonnes with a capacity of 28.5 million tonnes. In 2009-10, Mormugoa port had reported traffic of 48.85 million tonnes with a capacity of 37.05 million tonnes. In 2013-14 Mormugoa port had reported traffic of 11.74 million tonnes with a capacity of 36.65 million tonnes.
In Utilization (%) point of view at J.L.Nehru port, a upward trend seen from 99.12% (2004-05) to 102.7% (2011-12) bottoming in the year 2006-07 (88.49%) and a gradual downward trend seen from 102.7% (2011-12) to 94.61% (2013-14). In 2004-05, J.L.Nehru port had reported traffic of 32.81 million tonnes with a capacity of 33.1 million tonnes. In 2011-12, J.L.Nehru port had reported traffic of 65.73 million tonnes with a capacity of 64 million tonnes. In 2013-14 J.L.Nehru port had reported traffic of 62.33 million tonnes with a capacity of 65.88 million tonnes.
In Utilization (%) point of view at Mumbai port, a upward trend seen from 82.03% (2004-05) to 104.39% (2008-09) and a drastic upward trend seen from 104.39% (2008-09) to 132.9% (2013-14). In 2004-05, Mumbai port had reported traffic of 35.19 million tonnes with a capacity of 42.9 million tonnes. In 2008-09, Mumbai port had reported traffic of 51.88 million tonnes with a capacity of 49.7 million tonnes. In 2013-14 Mumbai port had reported traffic of 59.18 million tonnes with a capacity of 44.53 million tonnes.
In Utilization (%) point of view at Kandla port, a upward trend seen from 92.33% (2004-05) to 100.43% (2012-13) and a drastic downward trend seen from 100.43% (2012-13) to 85.04% (2013-14). In 2004-05, Kandla port had reported traffic of 41.55 million tonnes with a capacity of 45 million tonnes. In 2012-13, Kandla port had reported traffic of 93.62 million tonnes with a capacity of 93.22 million tonnes. In 2013-14 Kandla port had reported traffic of 87.01 million tonnes with a capacity of 102.32 million tonnes.