 GOVERNMENT
OF INDIA
GOVERNMENT
OF INDIA
A Digital India Initiative
GOVERNMENT
OF INDIA


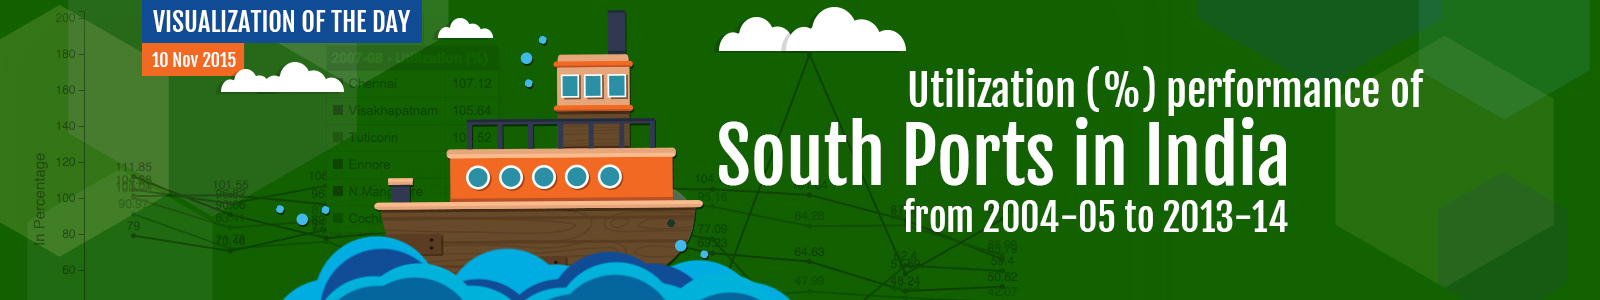
India has a coastline spanning of 7516.6 kilometres, forming one of the biggest peninsulas and sixteenth largest maritime country in the world. It is serviced by 13 major ports namely Kolkata, Haldia, Paradip, Visakhapatnam, Ennore, Chennai, Tuticorin, Cochin, N.Mangalore, Mormugoa, J.L.Nehru, Mumbai and Kandla.
In South side of India there are 6 Major ports namely Visakhapatnam, Ennore, Chennai, Tuticorin, Cochin and N.Mangalore. In Utilization (%) point of view at Visakhapatnam port, a gradual upward trend seen from 101.01% (2004-05) to 104.79% (2010-11) bottoming in the year 2006-07 (96.39%) and a drastic downward trend seen from 104.79% (2010-11) to 65.79% (2013-14). In 2004-05, Visakhapatnam port had traffic of 50.15 million tonnes with a capacity of 49.65 million tonnes. In 2010-11, Visakhapatnam port had traffic of 68.04 million tonnes with a capacity of 64.93 million tonnes. In 2013-14 Visakhapatnam port had traffic of 58.5 million tonnes with a capacity of 88.92 million tonnes.
In Utilization (%) point of view at Ennore port, a gradual downward trend seen from 79% (2004-05) to 35.48% (2010-11) and a drastic upward trend seen from 35.48% (2010-11) to 88.19% (2013-14). In 2004-05, Ennore port had traffic of 9.48 million tonnes with a capacity of 12 million tonnes. In 2010-11, Ennore port had traffic of 11 million tonnes with a capacity of 31 million tonnes. In 2013-14 Ennore port had traffic of 27.34 million tonnes with a capacity of 31 million tonnes.
In Utilization (%) point of view at Chennai port, a drastic downward trend seen from 104.68% (2004-05) to 17.98% (2011-12) and a drastic upward trend seen from 17.98% (2011-12) to 59.4% (2013-14). In 2004-05, Chennai port had traffic of 43.81 million tonnes with a capacity of 41.85 million tonnes. In 2011-12, Chennai port had traffic of 14.96 million tonnes with a capacity of 83.19 million tonnes. In 2013-14 Chennai port had traffic of 51.11 million tonnes with a capacity of 86.04 million tonnes.
In Utilization (%) point of view at Tuticorin port, a upward trend seen from 100.06% (2004-05) to 103.52% (2007-08) and drastic downward trend seen from 103.52% (2007-08) to 68.09% (2013-14). In 2004-05, Tuticorin port had traffic of 15.81 million tonnes with a capacity of 15.8 million tonnes. In 2007-08, Tuticorin port had traffic of 21.48 million tonnes with a capacity of 20.75 million tonnes. In 2013-14 Tuticorin port had traffic of 28.64 million tonnes with a capacity of 42.06 million tonnes.
In Utilization (%) point of view at Cochin port, a drastic downward trend seen from 90.97% (2004-05) to 43.61% (2010-11) and a downward trend seen from 43.61% (2010-11) to 42.07% (2013-14). In 2004-05, Cochin port had traffic of 14.1 million tonnes with a capacity of 15.5 million tonnes. In 2010-11, Cochin port had traffic of 17.87 million tonnes with a capacity of 40.98 million tonnes. In 2013-14 Cochin port had traffic of 20.89 million tonnes with a capacity of 49.66 million tonnes.
In Utilization (%) point of view at N.Mangalore port, a drastic downward trend seen from 111.85% (2004-05) to 48.24% (2012-13) and a upward trend seen from 48.24% (2012-13) to 50.62% (2013-14). In 2004-05, N.Mangalore port had traffic of 33.89 million tonnes with a capacity of 30.3 million tonnes. In 2012-13, N.Mangalore port had traffic of 37.04 million tonnes with a capacity of 76.77 million tonnes. In 2013-14 N.Mangalore port had traffic of 39.37 million tonnes with a capacity of 77.77 million tonnes.