 GOVERNMENT
OF INDIA
GOVERNMENT
OF INDIA
A Digital India Initiative
GOVERNMENT
OF INDIA


Monetary policy of a country has a short term impact on inflation and the economy-wide demand for goods and services. Hence, the demand for the human resources who produce those goods and services also fluctuates. When monetary policy is used to reduce inflation, countries face problems to control unemployment. This scenario was well explained by economist A. W. Phillips in 1958, where he showed that when inflation is high, unemployment is low, and vice versa. This relationship is now well known as the Phillips curve. If an economy experienced inflation, monetary policy is used to curve the inflation down, either by contracting the money supply or by raising the interest rates, higher interest rates reduce consumer spending and investment leading to lower aggregate demand, while aggregate supply remains the same. With the fall of aggregate demand, inflation would decline. However, if there is a decline in Real GDP, firms will employ fewer employees leading to a rise in unemployment.
In the Indian scenario, let’s take a look at the relationship between inflation and 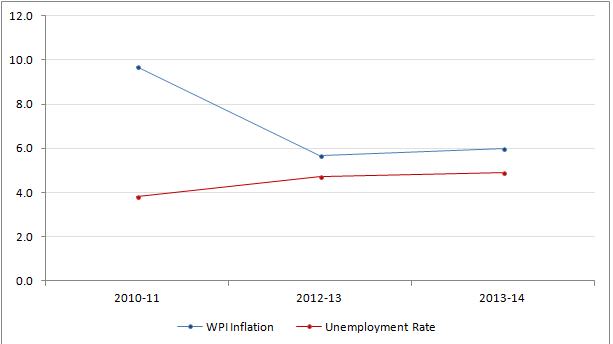 unemployment and see if we can find the Phillips Curve at work, for this purpose we have studied data points of just 3 years (2010-11, 2012-13, 2013-14, the data points of 2011-12 have not been considered due to unavailability of unemployment rate in Labor bureau of India).
In 2010-11, the unemployment rate was about 3.8%, while inflation (WPI) was bit on a higher side 9.7%. Then in 2012-13, we saw a rise in unemployment to 4.7%% (source: Labor bureau of India), whereas inflation declined to 5.7% (source: https://data.gov.in/catalog/wholesale-price-index-base-year-2004-05#web_catalog_tabs_block_10).
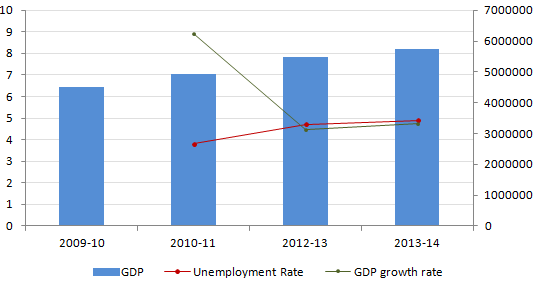 It has also been observed that,for high GDP growth, unemployment has fallen sharply, for example in 2010-11 GDP growth rate was at 8.91% and unemployment rate was only at 3.8%, but when GDP growth rate declined to 4.47% in 2012-13, unemployment rate increased to 4.7%.
In some periods , It is also possible to have a rise in both inflation and unemployment. For example, inflation rate increased from 5.7% in 2012-13 to 6% in 2013-14, and during this period unemployment have also increased from 4.7% to 4.9%. This implies that it can happen due to cost-push inflation, the aggregate supply curve would shift and there would be a fall in economic activity and higher prices. However, we could debate this by the Monetarist view, but there can be still a trade off. If the RBI sought to reduce the cost-push inflation through higher interest rates, they could. However, it would lead to an even bigger rise in unemployment.
By plotting these points on a graph, we can see the normal Phillips curve (unemployment vs Inflation), which is downward sloping with 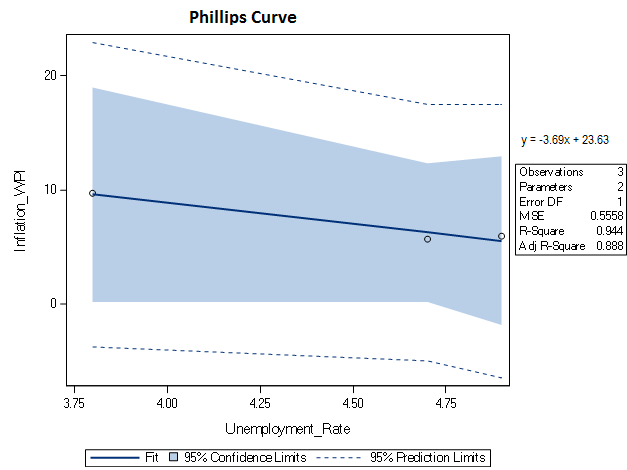 following normal linear regression model y = -3.69x + 23.63 with R² = 0.94 and F value=16.86. (** Please note that data points were insufficient to run regression model , minimum of 15-20 observations were required to run that).
Conventionally, the Phillips curve augmented for expectations of inflation represents the tradeoff between inflation and unemployment in an economy in the following way: gpT = gpeT – ß (UT − x̄) + ɛ where, (gp) is actual inflation rate, (gpe) is expected inflation rate, (UT − x̄) is cyclical unemployment given by the difference of unemployment rate (u) and natural rate of unemployment (x̄) and (e) is an error term. The parameter (ß) measures the response of inflation to cyclical unemployment. The distance between U and x̄is called unemployment gap.
But, we would not get a regular Phillips curve in India because we have to adjust for exogenous factors,some of the studies i.e Paul (2009) , Patra and Ray (2010) , Manoj Kumar (2012) etc. suggest that extended Phillips curve model can be applicable for India.

Comprehensive Analysis of the Mahatma Gandhi Natio...
This infographics on Comprehensive Analysis of the Mahatma Gandhi National Rural Employment Guarantee Act (MGNREGA)
Posted on: October 18th, 2023

First Census of Water Bodies in Haryana...
For the first time in the history of the country, the Ministry of Jal Shakti has conducted the first-ever census of water bodies in India. ...
Posted on: August 31st, 2023