 GOVERNMENT
OF INDIA
GOVERNMENT
OF INDIA
A Digital India Initiative
GOVERNMENT
OF INDIA


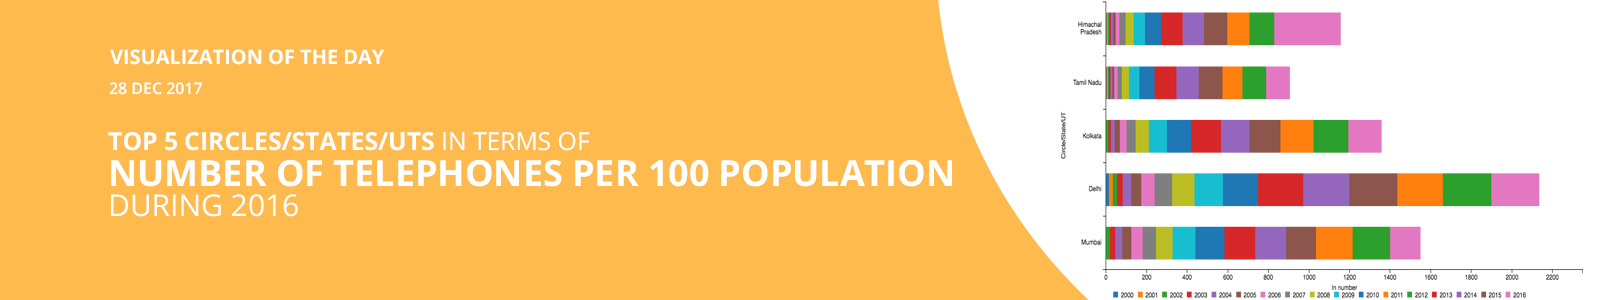
The telecom services have been recognized the world-over as an important tool for socio economic development for a nation and hence telecom infrastructure is treated as a crucial factor to realize the socio-economic objectives in India. Accordingly, the Department of Telecom has been formulating developmental policies for the accelerated growth of the telecommunication services. The top 5 Circles/States/UTs in terms of number of Telephones per 100 Population during 2016 were: Himachal Pradesh, Delhi, Kolkata, Mumbai and Tamil Nadu.
We have seen an annual growth of 186.07% in number of Telephones per 100 Population in Himachal Pradesh from 114.52 during 2015 to 327.61 during 2016. In Himachal Pradesh, there was annual growth of 8.46% in number of Telephones per 100 Population during 2015 over 2014 from 105.59. We have seen an annual growth of -0.71% in number of Telephones per 100 Population in Delhi from 237.99 during 2015 to 236.29 during 2016. In Delhi, there was annual growth of 4.92% in number of Telephones per 100 Population during 2015 over 2014 from 226.84.
We have seen an annual growth of 8.89% in number of Telephones per 100 Population in Kolkata from 150.2 during 2015 to 163.56 during 2016. In Kolkata, there was annual growth of 5.28% in number of Telephones per 100 Population during 2015 over 2014 from 142.67. We have seen an annual growth of 1.21% in number of Telephones per 100 Population in Mumbai from 147.81 during 2015 to 149.6 during 2016. In Mumbai, there was annual growth of -2.69% in number of Telephones per 100 Population during 2015 over 2014 from 151.9.
We have seen an annual growth of 0.52% in number of Telephones per 100 Population in Tamil Nadu from 117.52 during 2015 to 118.13 during 2016. In Tamil Nadu, there was annual growth of 5.74% in number of Telephones per 100 Population during 2015 over 2014 from 111.14.
Note: Data includes Public DELs, Pvt. DELs, CMPs and WLL (Fixed & Limited); Data values are as on 31st March for every year; Data of Chhattisgarh, Jharkhand, North East-II, Uttarakhand, Kolkata and Chennai are included in Madhya Pradesh, Bihar, North East-I, Uttar Pradesh-(E&W), West Bengal and Tamil Nadu respectively; Source: Department of Telecommunications and also published in Statistical Year Book 2017 by MOSPI.
Dataset URL: https://data.gov.in/catalog/telephones-100-population-state-wise
Resource Title: State-wise Telephones Per 100 Population from 2000 to 2016