 GOVERNMENT
OF INDIA
GOVERNMENT
OF INDIA
A Digital India Initiative
GOVERNMENT
OF INDIA


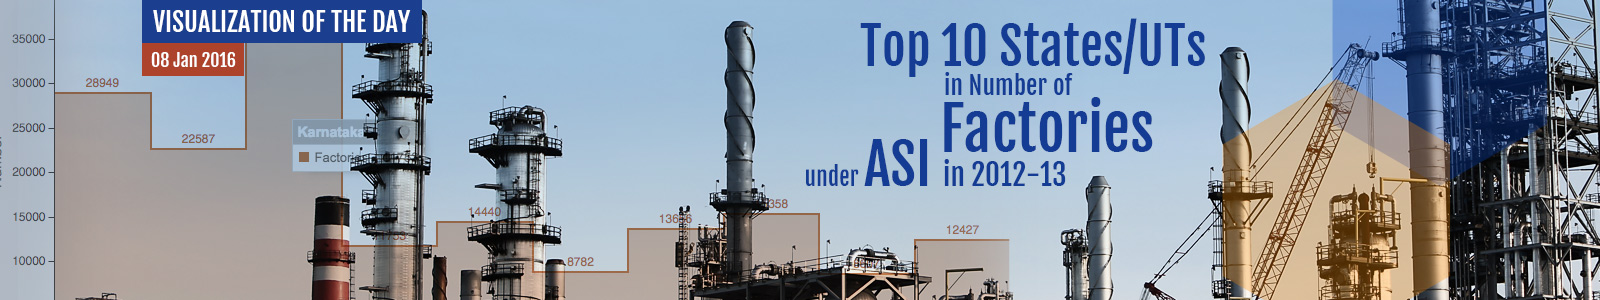
India had 222120 factories under Annual Survey of Industries (ASI). Annual Survey of Industries (ASI) covers all factories registered under Sections 2m(i) and 2m(ii) of the Factories Act, 1948 i.e. those factories employing 10 or more workers using power; and those employing 20 or more workers without using power.
Tamil Nadu had 36869 factories categorized under Annual Survey of Industries, which was 16.6% of the total 222120 factories covered under ASI in India. Maharashtra had 28949 factories categorized under Annual Survey of Industries, which was 13.03% of the total 222120 factories covered under ASI in India. Gujarat had 22587 factories categorized under Annual Survey of Industries, which was 10.17% of the total 222120 factories covered under ASI in India. Andhra Pradesh had 15358 factories categorized under Annual Survey of Industries, which was 6.91% of the total 222120 factories covered under ASI in India. Uttar Pradesh had 14440 factories categorized under Annual Survey of Industries, which was 6.5% of the total 222120 factories covered under ASI in India.
Telangana had 13656 factories categorized under Annual Survey of Industries, which was 6.15% of the total 222120 factories covered under ASI in India. Punjab had 12427 factories categorized under Annual Survey of Industries, which was 5.59% of the total 222120 factories covered under ASI in India. Karnataka had 11753 factories categorized under Annual Survey of Industries, which was 5.29% of the total 222120 factories covered under ASI in India. Rajasthan had 8782 factories categorized under Annual Survey of Industries, which was 3.95% of the total 222120 factories covered under ASI in India. West Bengal had 8607 factories categorized under Annual Survey of Industries, which was 3.87% of the total 222120 factories covered under ASI in India.
Note: Value Figures in Rs. Lakhs & Others in Numbers.