 GOVERNMENT
OF INDIA
GOVERNMENT
OF INDIA
A Digital India Initiative
GOVERNMENT
OF INDIA


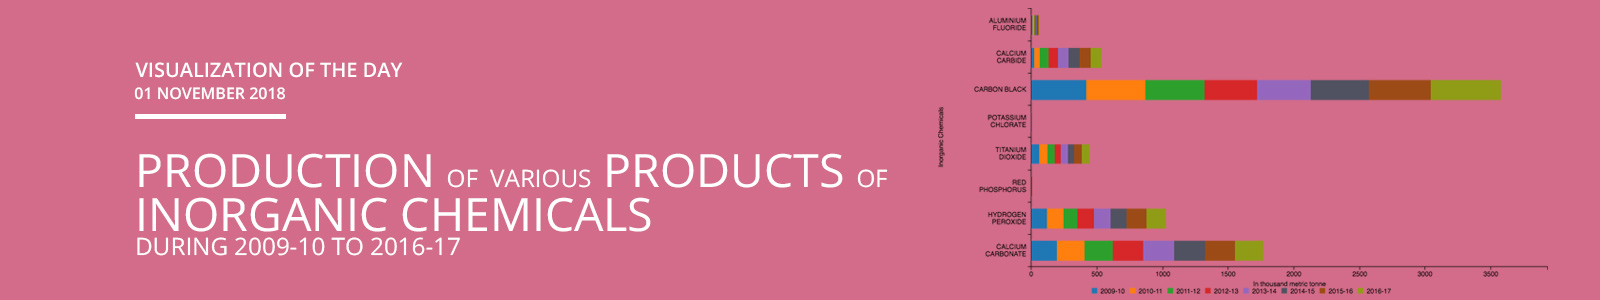
Production of Aluminium Fluoride was 11.551 thousand metric tonne during 2009-10. It has decreased by -15.2% to 9.795 thousand metric tonne during 2010-11 over 2009-10. We have observed an annual de-growth of -14.42% in Production of Aluminium Fluoride to 8.142 thousand metric tonne during 2016-17 versus 9.514 thousand metric tonne during 2015-16. Maximum annual growth rate of 41.33% has been seen in Production of Aluminium Fluoride in 2015-16 during the period under consideration. Production of Calcium Carbide was 22.022 thousand metric tonne during 2009-10. It has increased by 102.98% to 44.7 thousand metric tonne during 2010-11 over 2009-10. An annual growth of 1.86% has been seen in Production of Calcium Carbide from 83.472 thousand metric tonne during 2015-16 to 85.021 thousand metric tonne during 2016-17. Maximum annual growth rate of 102.98% has been observed in Production of Calcium Carbide in 2010-11 during the period under consideration.
Production of Carbon Black was 419.433 thousand metric tonne during 2009-10. It has increased by 7.87% during 2010-11 over 2009-10. We have observed an annual growth of 13.99% in Production of Carbon Black to 535.273 thousand metric tonne during 2016-17 versus 469.561 thousand metric tonne during 2015-16. Maximum annual growth rate of 13.99% has been seen in Production of Carbon Black in 2016-17 during the period under consideration. Production of Potassium Chlorate was 2.601 thousand metric tonne during 2009-10. It has decreased by -76.39% during 2010-11 over 2009-10. An annual decline of -97.04% has been seen in Production of Potassium Chlorate from 0.406 thousand metric tonne during 2015-16 to 0.012 thousand metric tonne during 2016-17. Maximum annual growth rate of 70.93% has been observed in Production of Potassium Chlorate in 2012-13 during the period under consideration.
Annual growth of 4.39% has been seen in Production of Titanium Dioxide from 61.324 thousand metric tonne during 2009-10 to 64.018 thousand metric tonne during 2010-11. We have observed an annual growth of -0.12% in Production of Titanium Dioxide to 58.46 thousand metric tonne during 2016-17 versus 58.533 thousand metric tonne during 2015-16. Maximum annual growth rate of 22.25% has been seen in Production of Titanium Dioxide in 2015-16 during the period under consideration. Production of Red Phosphorus was 0.58 thousand metric tonne during 2009-10. It has decreased by -17.07% during 2010-11 over 2009-10. An annual decline of -7.78% has been seen in Production of Red Phosphorus from 0.836 thousand metric tonne during 2015-16 to 0.771 thousand metric tonne during 2016-17. Maximum annual growth rate of 27.83% has been observed in Production of Red Phosphorus in 2015-16 during the period under consideration.
Annual growth of 9.39% has been seen in Production of Hydrogen Peroxide from 118.609 thousand metric tonne during 2009-10 to 129.746 thousand metric tonne during 2010-11. We have observed an annual growth of -2.75% in Production of Hydrogen Peroxide to 148.866 thousand metric tonne during 2016-17 versus 153.083 thousand metric tonne during 2015-16. Maximum annual growth rate of 27.83% has been seen in Production of Hydrogen Peroxide in 2015-16 during the period under consideration. Production of Calcium Carbonate was 196.33 thousand metric tonne during 2009-10. It has increased by 6.78% during 2010-11 over 2009-10. An annual decline of -4.33% has been seen in Production of Calcium Carbonate from 226.126 thousand metric tonne during 2015-16 to 216.329 thousand metric tonne during 2016-17. Maximum annual growth rate of 6.89% has been observed in Production of Calcium Carbonate in 2012-13 during the period under consideration.
Note: Figures are in Thousand Metric Tonne; Source: Manufactures under large and medium scale; Disclaimer: Department of Chemicals and Petrochemicals does not take responsibility for the accuracy of the information or any loss arising from the use of information; ** Data to be released on half yearly basis. Annual data for the previous years and for the period from April to September for the current year will be released in the last fortnight of January and annual data up to the last financial year will be released in the last fortnight of July. Revision in the data base, if required, will be done in the first week of April and October.
Dataset URL: https://data.gov.in/catalog/production-major-chemicals-product-wise-group-wise
Resource Title: Production of Major Chemicals – Product-wise / Group-wise from 2009-10 to 2017-18 (Upto September 2017)