 GOVERNMENT
OF INDIA
GOVERNMENT
OF INDIA
A Digital India Initiative
GOVERNMENT
OF INDIA


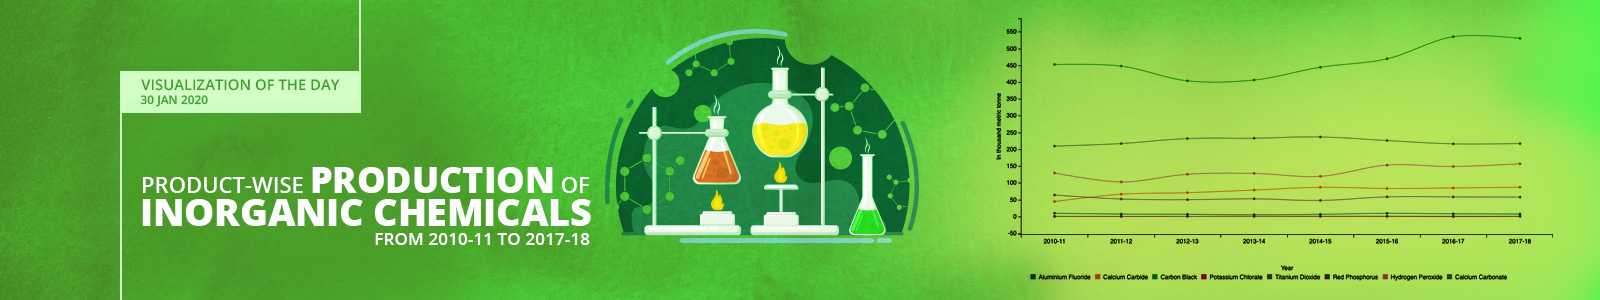
Products namely Aluminium Fluoride, Calcium Carbide, Carbon Black, Potassium Chlorate, Titanium Dioxide, Red Phosphorus, Hydrogen Peroxide and Calcium Carbonate were produced in India under Inorganic Chemicals group during 2010-11 to 2017-18. Production of Aluminium Fluoride was 7.31 thousand metric tonne during 2011-12, down by -25.41% against 9.8 thousand metric tonne during 2010-11. Annual de-growth of -7.74% has been observed in production of Aluminium Fluoride from 8.14 thousand metric tonne during 2016-17 to 7.51 thousand metric tonne during 2017-18. Production of Calcium Carbide was 44.7 thousand metric tonne during 2010-11. It has increased by 48.52% to 66.39 thousand metric tonne during 2011-12 over 2010-11. We have seen annual growth of 2.68% in production of Calcium Carbide to 87.3 thousand metric tonne during 2017-18 versus 85.02 thousand metric tonne during 2016-17.
Production of Carbon Black was 452.44 thousand metric tonne during 2010-11. It has decreased by -105 basis points to 447.67 thousand metric tonne during 2011-12 over 2010-11. We have found annual decline of -92 basis points in production of Carbon Black to 530.36 thousand metric tonne during 2017-18 against 535.27 thousand metric tonne during 2016-17. Production of Potassium Chlorate was 0.61 thousand metric tonne during 2011-12, down by -44.26% against 0.34 thousand metric tonne during 2010-11. Annual growth of 3400% has been observed in production of Potassium Chlorate to 0.35 thousand metric tonne during 2017-18 from 0.01 thousand metric tonne during 2016-17.
Production of Titanium Dioxide was 52.14 thousand metric tonne during 2011-12, down by -18.56% against 64.02 thousand metric tonne during 2010-11. Annual decline of -1.09% has been observed in production of Titanium Dioxide from 58.46 thousand metric tonne during 2016-17 to 57.82 thousand metric tonne during 2017-18. Production of Red Phosphorus was 0.48 thousand metric tonne during 2010-11. It has increased by 16.67% to 0.56 thousand metric tonne during 2011-12 over 2010-11. We have found annual growth of 14.29% in production of Red Phosphorus to 0.88 thousand metric tonne during 2017-18 against 0.77 thousand metric tonne during 2016-17.
Production of Hydrogen Peroxide was 129.75 thousand metric tonne during 2010-11. It has decreased by -20.56% to 103.07 thousand metric tonne during 2011-12 over 2010-11. We have seen annual growth of 5.47% in production of Hydrogen Peroxide to 157.02 thousand metric tonne during 2017-18 versus 148.87 thousand metric tonne during 2016-17. Production of Calcium Carbonate was 217.2 thousand metric tonne during 2011-12, up by 3.6% against 209.65 thousand metric tonne during 2010-11. Annual growth of 43 basis points has been observed in production of Calcium Carbonate from 216.33 thousand metric tonne during 2016-17 to 217.25 thousand metric tonne during 2017-18.
Note: Figures are in Thousand Metric Tonne; Source: Manufactures under large and medium scale; Disclaimer: Department of Chemicals and Petrochemicals does not take responsibility for the accuracy of the information or any loss arising from the use of information; ** Data to be released on half yearly basis. Annual data for the previous years and for the period from April to September for the current year will be released in the last fortnight of January and annual data up to the last financial year will be released in the last fortnight of July. Revision in the data base, if required, will be done in the first week of April and October.
Dataset URL: https://data.gov.in/resources/production-major-chemicals-product-wise-group-wise-2010-11-2018-19-upto-september-2018
Resource Title: Production of Major Chemicals – Product-wise / Group-wise from 2010-11 to 2018-19 (upto September 2018)