 GOVERNMENT
OF INDIA
GOVERNMENT
OF INDIA
A Digital India Initiative
GOVERNMENT
OF INDIA


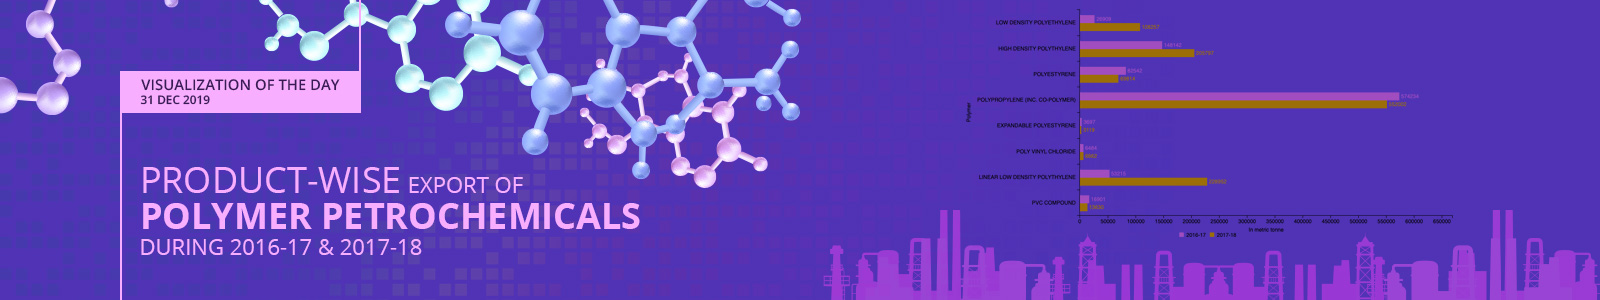
Polymer products namely Low Density Polyethylene, High Density Polyethylene, Polystyrene, Polypropylene (Inc. Co-Polymer), Expandable Polystyrene, Poly Vinyl Chloride, Linear Low Density Polyethylene and PVC Compound were exported under major petrochemicals during 2010-11 to 2017-18.
Compound annual growth rate (CAGR) of 37.05%, 6.38%, 1.55%, -0.67%, 50.54%, -6.73%, 47.87% and 12.4% has been seen in export of Low Density Polyethylene, High Density Polyethylene, Polystyrene, Polypropylene (Inc. Co-Polymer), Expandable Polystyrene, Poly Vinyl Chloride, Linear Low Density Polyethylene and PVC Compound respectively during 2010-11 to 2017-18. Top 3 Polymer products in terms of export of petrochemicals during 2017-18 were Polypropylene (Inc. Co-Polymer), Linear Low Density Polyethylene and High Density Polyethylene.
Export of Polypropylene (Inc. Co-Polymer) was 735410 metric tonne during 2015-16. It has decreased by -21.92% to 574234 metric tonne during 2016-17 over 2015-16. We have observed annual decline of -3.87% in export of Polypropylene (Inc. Co-Polymer) during 2017-18 to 552002 metric tonne. Annual growth of 330.24% has been found in export of Linear Low Density Polyethylene to 228952 metric tonne during 2017-18 versus 53215 metric tonne during 2016-17. Whereas it was 15825 metric tonne during 2015-16. Export of High Density Polyethylene was 205797 metric tonne during 2017-18, up by 38.92% against 148142 metric tonne during 2016-17.
During 2017-18, Export of Low Density Polyethylene, Polystyrene, Expandable Polystyrene, Poly Vinyl Chloride and PVC Compound was 108257, 69814, 3119, 6662 and 13630 metric tonne respectively. Annual growth of 302.31%, -15.42%, -15.63%, 2.75% and -19.35% has been seen in Export of Low Density Polyethylene, Polystyrene, Expandable Polystyrene, Poly Vinyl Chloride and PVC Compound respectively during 2017-18 against 2016-17.
Note: Figures of QTY are in Metric Tonne; Figures of VAL are in Rs. Lakh; Source: DGCI & S, Kolkata, Ministry of Commerce & Industry; Disclaimer: Department of Chemicals and Petrochemicals does not take responsibility for the accuracy of the information or any loss arising from the use of information. ** Data to be released on half yearly basis. Annual data for the previous years and for the period from April to September for the current year will be released in the last fortnight of January and annual data up to the last financial year will be released in the last fortnight of July. Revision in the data base, if required, will be done in the first week of April and October.
Dataset URL: https://data.gov.in/resources/export-major-petrochemicals-product-wise-group-wise-2010-11-2018-19-upto-september-2018
Resource Title: Export of Major Petrochemicals – Product wise / Group wise from 2010-11 to 2018-19 (upto September 2018)