 GOVERNMENT
OF INDIA
GOVERNMENT
OF INDIA
A Digital India Initiative
GOVERNMENT
OF INDIA


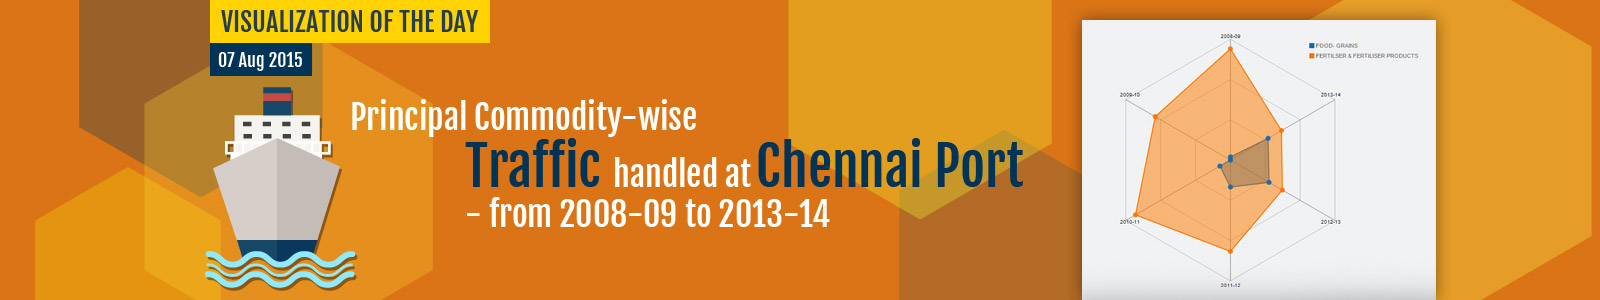 The total traffic handled at Chennai Port of Fertiliser And Fertiliser Products was 783 thousand tonnes in 2008-09. The total traffic handled at Chennai Port of Fertiliser And Fertiliser Products was 611 thousand tonnes in 2009-10.There was an absolute decline of -172 thousand tonnes in 2009-10 (-21.97%) as compared to 2008-09. The total traffic handled at Chennai Port of Fertiliser And Fertiliser Products was 771 thousand tonnes in 2010-11.There was an absolute growth of 160 thousand tonnes in 2010-11 (26.19%) as compared to 2009-10.
The total traffic handled at Chennai Port of Fertiliser And Fertiliser Products was 643 thousand tonnes in 2011-12.There was an absolute decline of -128 thousand tonnes in 2011-12 (-16.6%) as compared to 2010-11. The total traffic handled at Chennai Port of Fertiliser And Fertiliser Products was 422 thousand tonnes in 2012-13.There was an absolute decline of -221 thousand tonnes in 2012-13 (-34.37%) as compared to 2011-12. The total traffic handled at Chennai Port of Fertiliser And Fertiliser Products was 415 thousand tonnes in 2013-14.There was an absolute decline of -7 thousand tonnes in 2013-14 (-1.66%) as compared to 2012-13.
The total traffic handled at Chennai Port of Food- Grains was 22 thousand tonnes in 2008-09. The total traffic handled at Chennai Port of Food- Grains was nil in 2009-10. The total traffic handled at Chennai Port of Food- Grains was 85 thousand tonnes in 2010-11.There was an absolute growth of 85 thousand tonnes in 2010-11 as compared to the year 2009-10. The total traffic handled at Chennai Port of Food- Grains was 190 thousand tonnes in 2011-12.There was an absolute growth of 105 thousand tonnes in 2011-12 (123.53%) as compared to the year 2010-11. The total traffic handled at Chennai Port of Food- Grains was 314 thousand tonnes in 2012-13.There was an absolute growth of 124 thousand tonnes in 2012-13 (65.26%) as compared to the year 2011-12. The total traffic handled at Chennai Port of Food- Grains was 306 thousand tonnes in 2013-14.There was an absolute decline of -8 thousand tonnes in 2013-14 (-2.55%) as compared to the year 2012-13.
Note: Figures in (000 Tonnes), Source: Chennai Port