 GOVERNMENT
OF INDIA
GOVERNMENT
OF INDIA
A Digital India Initiative
GOVERNMENT
OF INDIA


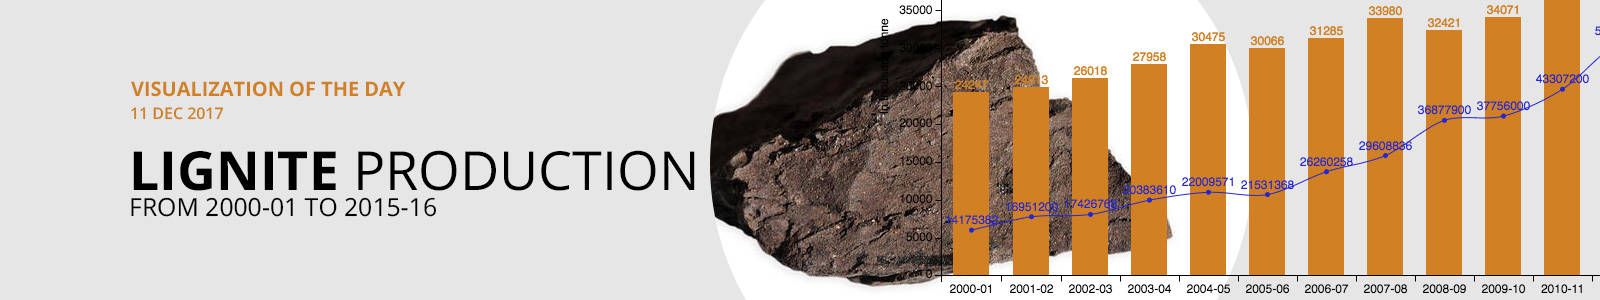
We have seen a compound annual growth rate of 4.05% in production of Lignite from 24247 thousand tonne during 2000-01 to 44008 thousand tonne during 2015-16.
Lignite production was 24247 thousand tonne during 2000-01. In value term, it was Rs. 14175382 thousand during 2000-01. Lignite production was 24813 thousand tonne during 2001-02. In value term, it was Rs. 16951200 thousand during 2001-02. It increased by 566 thousand tonne during 2001-02 as compared to the previous year 2000-01. In percentage term, the increase was 2.33% during 2001-02 over 2000-01.
We have seen an annual growth of 8.61% in production of Lignite from 31285 thousand tonne during 2006-07 to 33980 thousand tonne during 2007-08. Its value was Rs. 26260258 thousand and Rs. 29608836 thousand during 2006-07 and 2007-08 respectively. Lignite production was 32421 thousand tonne during 2008-09. In value term, it was Rs. 36877900 thousand during 2008-09. It decreased by 1559 thousand tonne during 2008-09 as compared to the previous year 2007-08. In percentage term, the decrease was -4.59% during 2008-09 over 2007-08.
We have seen an annual growth of 9.1% in production of Lignite from 44271 thousand tonne during 2013-14 to 48300 thousand tonne during 2014-15. Its value was Rs. 59675300 thousand and Rs. 81627000 thousand during 2013-14 and 2014-15 respectively. Lignite production was 44008 thousand tonne during 2015-16. In value term, it was Rs. 76226809 thousand during 2015-16. It decreased by 4292 thousand tonne during 2015-16 as compared to the previous year 2014-15. In percentage term, the decrease was -8.89% during 2015-16 over 2014-15.
The maximum annual growth of 4599 thousand tonne was recorded in production of Lignite in the year 2011-12 during the period under consideration. The maximum annual growth rate, i.e., 12.19% was recorded in production of Lignite in the year 2011-12 during the period under consideration.
Note: Value figures are in Rs ‘000; All minerals excludes data for atomic and minor minerals, natural gas and petroleum (crude); Totals may not tally as it has been revised; #: Includes others Metallic Minerals Values; 2015-16 data values are provisional; Source: Indian Bureau of Mines, Ministry of Mines and also published in Statistical Year Book 2017 by MOSPI.