 GOVERNMENT
OF INDIA
GOVERNMENT
OF INDIA
A Digital India Initiative
GOVERNMENT
OF INDIA


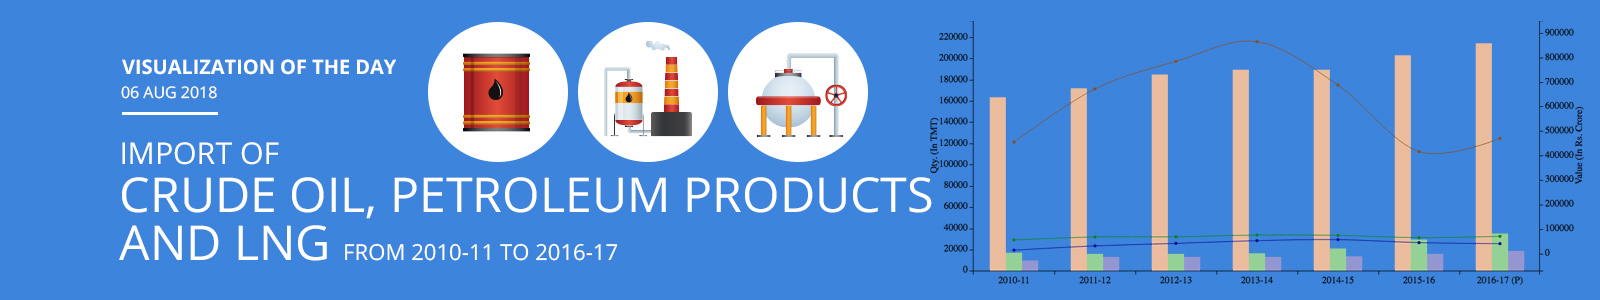
Compound annual growth rate of 5.81% was seen in total Import of Crude Oil, Petroleum Products and Liquefied Natural Gas (LNG) from 190905.689 thousand metric tonnes (TMT) during 2010-11 to 267976.168 TMT during 2016-17. Its value was Rs. 525636.655 crore and Rs. 581791.786 crore during 2010-11 and 2016-17 respectively.
Import of Crude Oil was 163595 TMT during 2010-11. It has increased by 4.97% to 171729.154 TMT during 2011-12 over 2010-11. Its value was Rs. 455276.3 crore and Rs. 672219.842 crore during 2010-11 and 2011-12 respectively. We have observed a growth of 5.46% in Crude Oil Import from 202850.492 TMT during 2015-16 to 213932.03 TMT during 2016-17. In value term it was Rs. 416578.845 crore during 2015-16 and Rs. 470251.338 crore during 2016-17.
Import of Petroleum Products was 17379.441 TMT during 2010-11. It has decreased by -8.8% to 15849.37 TMT during 2011-12 over 2010-11. Its value was Rs. 55998.315 crore and Rs. 68091.123 crore during 2010-11 and 2011-12 respectively. We have observed a growth of 20.22% in Petroleum Products Import from 29455.754 TMT during 2015-16 to 35413 TMT during 2016-17. In value term it was Rs. 65361.024 crore during 2015-16 and Rs. 70727.448 crore during 2016-17.
Import of LNG was 9931.248 TMT during 2010-11. It has increased by 33.06% to 13214.45 TMT during 2011-12 over 2010-11. Its value was Rs. 14362.04 crore and Rs. 31717.704 crore during 2010-11 and 2011-12 respectively. We have observed a growth of 15.42% in LNG Import from 16142.089 TMT during 2015-16 to 18631.138 TMT during 2016-17. In value term it was Rs. 45038 crore during 2015-16 and Rs. 40813 crore during 2016-17.
Maximum annual growth of 7.61% was found in 2012-13 in Import of Crude Oil during the period under consideration. Maximum annual growth of 38.28% was found in 2015-16 in Import of Petroleum Products during the period under consideration. Maximum annual growth of 33.06% was found in 2011-12 in Import of LNG during the period under consideration.
Note: NA: Not Available; P: Provisional; Source: Petroleum Planning & Analysis Cell.
Dataset URL: https://data.gov.in/catalog/indian-petroleum-and-natural-gas-statistics-2016-17
Resource Title: Import/Export of Crude Oil, LNG and Petroleum Products from 2010-11 to 2016-17