 GOVERNMENT
OF INDIA
GOVERNMENT
OF INDIA
A Digital India Initiative
GOVERNMENT
OF INDIA


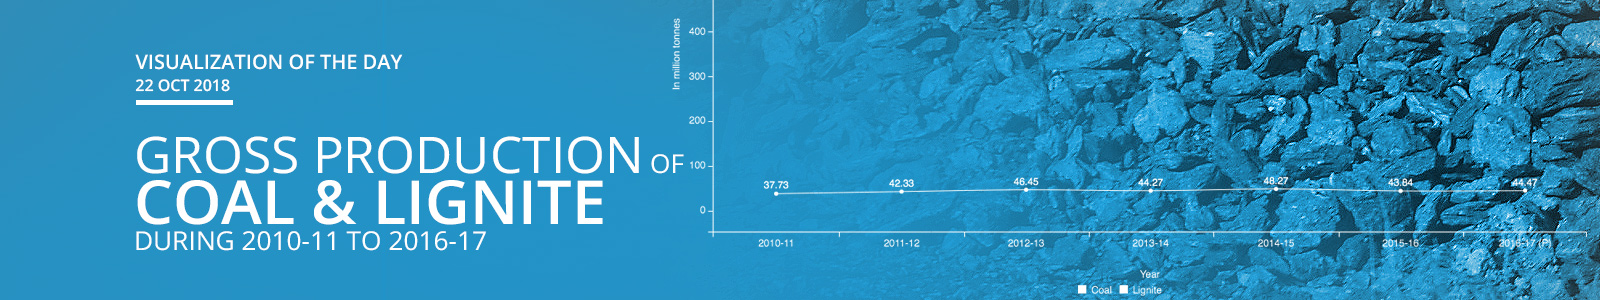
India has witnessed an increasing trend in Gross Production of Coal & Lignite during 2010-11 to 2016-17. We have observed compound annual growth rate of 3.55% in Gross Production of Coal & Lignite from 570.811 million tonnes during 2010-11 to 703.74 million tonnes during 2016-17. Annual growth rate of 3.03% has been seen in Gross Production of Coal & Lignite to 703.74 million tonnes during 2016-17 versus 683.07 million tonnes during 2015-16. Maximum annual Gross Production of 7.77% has been found in Coal & Lignite Production in 2014-15 during the period under consideration.
We have observed compound annual growth rate of 3.62% in Gross Production of Coal during 2010-11 to 2016-17. Gross Production of Coal was 532.7 million tonnes during 2010-11. It has increased by 1.36% to 539.95 million tonnes during 2011-12 over 2010-11. Annual growth rate of 3.14% has been seen in Gross Production of Coal to 659.27 million tonnes during 2016-17 versus 639.23 million tonnes during 2015-16. Maximum annual Gross Production of 7.67% has been found in Coal Production in 2014-15 during the period under consideration.
We have observed compound annual growth rate of 2.78% in Gross Production of Lignite during 2010-11 to 2016-17. Gross Production of Lignite was 37.73 million tonnes during 2010-11. It has increased by 12.19% to 42.33 million tonnes during 2011-12 over 2010-11. Annual growth rate of 1.44% has been seen in Gross Production of Lignite from 43.84 million tonnes during 2015-16 to 44.47 million tonnes during 2016-17. Maximum annual Gross Production of 12.19% has been found in Lignite Production in 2011-12 during the period under consideration.
Note: P: Provisional; Source: Economic Survey, M/o Coal, M/o Power and CEA.
Dataset URL: https://data.gov.in/catalog/indian-petroleum-and-natural-gas-statistics-2016-17
Resource Title: Gross Production of Energy by Various Sources in India from 2010-11 to 2016-17