 GOVERNMENT
OF INDIA
GOVERNMENT
OF INDIA
A Digital India Initiative
GOVERNMENT
OF INDIA


The Open Government Data Platform of India, has not only made it easy for the public at large to access government data in open format or machine readable format, but also has given facility to the public or the citizens to create various types of visualizations based on the datasets available on the Data Portal, India (www.data.gov.in). The user can also create visualizations based on his own data using the My Data visualization tool available on the website of the Data Portal, India.
There is a saying that ‘a picture is worth a thousand words’, and in order to materialize the same, the Data Portal, India has an emphasis on the visualizations. It helps in balancing the onerous quantitative figures or data with vivid imageries. Map, as created by the Visualization Tool available on the Data Portal, India, is very powerful and useful visualization, which blends both the data and vivid imagery into one. It shows the data, which has state-wise or district wise attributes/information, on the map of India plotting the data on respective states or districts of India.
Now, a new feather has been added in the cap of Data Portal, India in terms of the introduction of the facility of creation of visualizations based on map having Latitude and Longitude values.
An instance of map having Latitude and Longitude values is shown below:
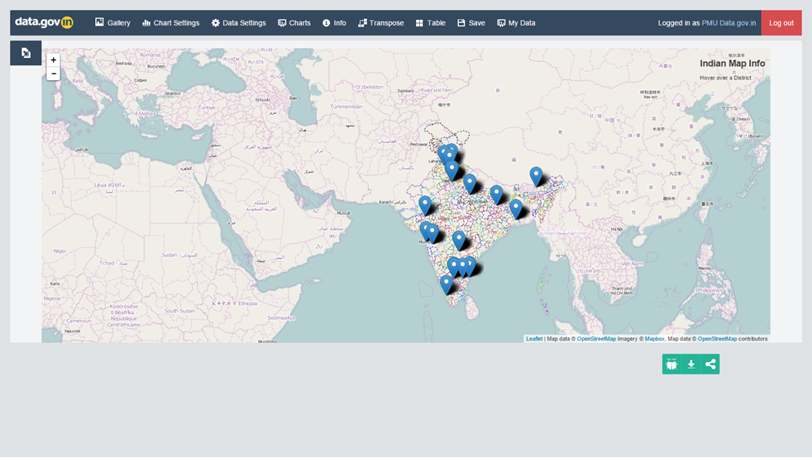
If any dataset has the values of latitude and longitude along with other variables/data values, we can use this dataset for making a map based visualization. On the map, the variable values would be plotted on the relevant places, say a particular state in India or a specific district in a state, in accordance with the coordinates specified or given as per the latitude and longitude values in the dataset.
The users can also show the information/data on the labels which would be displayed on particular locations specified by the coordinates given as per the latitude and longitude values in the dataset. The user can choose to display a single piece of information or data on the label or a number of data on the label.
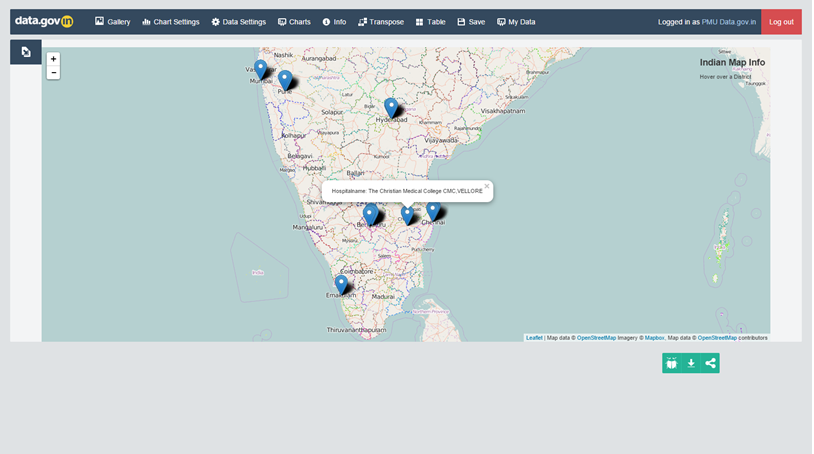
For instance, a map having Latitude and Longitude values with regard to hospitals in India is given below. It also shows the data label i. e. the name of the hospital, as shown in the visualized map below:

There is a facility for zoom-in and zoom-out the map having Latitude and Longitude values to different levels or magnitude. For example, a map having Latitude and Longitude values is shown in a zoomed mode, with focus on the southern peninsula of India as given below:
Thus, now users, from amongst the public, can make use of this tool to create maps visualizing the data as per the latitude and longitude values. The users can also download the map having latitude and longitude values and utilize the same for incorporating it into any report, presentation or any other use. It will definitely make a powerful impact in their presentations or reports etc.